Download
1 / 43
430 likes | 523 Views
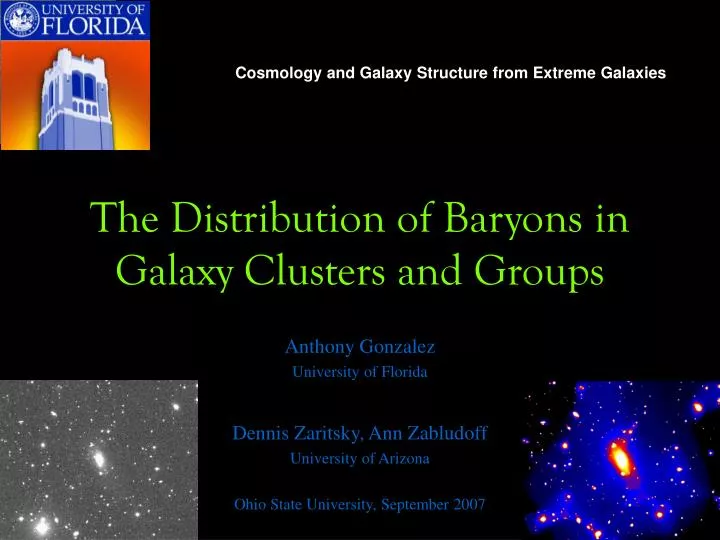
Cosmology and Galaxy Structure from Extreme Galaxies. The Distribution of Baryons in Galaxy Clusters and Groups. Anthony Gonzalez University of Florida Dennis Zaritsky, Ann Zabludoff University of Arizona Ohio State University, September 2007. Intracluster Light.

E N D
Cosmology and Galaxy Structure from Extreme Galaxies The Distribution of Baryons in Galaxy Clusters and Groups Anthony Gonzalez University of Florida Dennis Zaritsky, Ann Zabludoff University of Arizona Ohio State University, September 2007
Intracluster Light What is Intracluster Light (ICL)? • Free-floating stars bound only to cluster potential • Originally postulated to exist by Zwicky • Also known as intracluster stars (ICS)
Intracluster Light & Brightest Cluster Galaxies Counting Baryons Chemical Enrichment of the ICM Evolution of the Cluster Galaxy Populations The Structure of Galaxies
Intracluster Light Evidence for Intracluster Light (ICL)? • Intracluster planetary nebulae and globular clusters in Virgo • Feldmeier et al. (2003,2004) • Williams et al. (2007) • Extended excess surface brightness relative to central BCG profile • Rising velocity dispersion profiles around BCGs • Dressler (1979), Carter et al. (1985), • Kelson et al. (2002)
Kelson et al. 2002 Galaxies Intracluster Light: A definition Evidence for Intracluster Light (ICL)? • Intracluster planetary nebulae in Virgo • Feldmeier et al. • Extended excess surface brightness relative to central BCG profile • Rising velocity dispersion profiles around BCGs • Dressler (1979), Carter et al. (1985), • Kelson et al. (2002) BCG and ICL
Intracluster Light What do we know? • Prevailing view: ICL contains non-negligible fraction of stars in all clusters • Can be generated by mergers and tidal stripping; produced in current simulations • But...quantifying total contribution of ICL challenging due to low SB Open questions... • Fraction of light/baryons in ICL • Structure and Distribution of ICL • ICL properties vs. cluster mass and radius
Our work, the first step...An intracluster light survey • Highly uniform data • Drift scan imaging from LCO 1m (300-1000s) in Gunn I • 30 Abell/APM clusters (150-1050 km/s) at z=0.03-0.13 • Reduction techniques optimized for low surface brightness photometry • Flatness variations <0.2% • Efficient removal of all other sources of flux • Other stars/galaxies • Extended PSFs of saturated stars • Large scale sky gradients (>> size of BCG) • Full 2D profile modelling with GALFIT
Final Data Quality • Initial sky level: mI≈20 mag arcsec-2 • Systematic uncertainty (5s): mI≈27.5 mag arcsec-2 • Equivalent physical radius: r ≈ 200-600 h70-1 kpc
Abell 2955 An Illustration Series of images here showing A2955 in the original, star-subtracted, and wavelet image. Put on a label saying what the limiting sb level is in the wavelet image, and a rough estimate of the scale
Abell 2571: An Example Sharp breaks in ellipticity and PA Single deV (r1/4)
Abell 2571: An Example Sharp breaks in ellipticity and PA deV – Sersic Avg Dc2= 3650 (1 dof) Single Sersic (r1/n)
Abell 2571: An Example • BCG, ICL profiles separable • ~80% of combined luminosity is in ICL
Intracluster Light & Brightest Cluster Galaxies Counting Baryons Are galaxy clusters fair samples of the universe? Do we see all the expected baryons?
Ettori et al. 2006 Baryon Budget: Theoretical Expectations Kravtsov et al. 2005 • What does one expect: • Roughly constant baryon fraction with mass • Some offset from WMAP baryon fraction
Theoretical Expectations Ettori et al. 2006 Kravtsov et al. 2005 • What does one expect: • Roughly constant baryon fraction with mass • Some offset from WMAP baryon fraction • Stellar baryons more centrally concentrated than gas Gas Stars
Lin, Mohr, & Stanford 2003 Observational Constraints Vikhlinin et al. 2006 • What does one see: • Increasing gas fraction (fg)with cluster mass • Increasing total baryon fraction (fg + f*) with M200 • Limited information about radial dependence of total baryon fraction Is the baryon census complete?
A New Census of Stellar Baryons Including the ICL • Specific objectives • Relative importance of ICL and galaxies • Stellar baryon fraction • Distribution of stellar baryons • Dependence upon halo mass • Total baryon fraction • Dependence upon halo mass • X-ray data do not exist for most of our sample, so this must be done using published relations
Tools for the Census... Prerequisites • Cluster Radius • Cluster Mass r200 r500 r2500 23’
Tools for the Census... Prerequisites • Cluster Radius • X-ray data generally lacking for sample • Calibrate -r500 and -r200 using subsets of Vikhlinin et al. and Arnaud et al. samples • Cross-check using Hansen et al. (2005) approach to directly measure galaxy overdensity relative to field • Cluster Mass • Velocity dispersions for 23 clusters in sample • Calibrate a -M500 relation using subset of Vikhlinin et al. sample
Tools for the Census... -M500 relation • Published dispersions for subset of Vikhlinin clusters • Calibrated for >500 km/s For total baryon fraction we will focus upon range where the relation is calibrated. Gonzalez et al. 2007
Selection Bias? Stellar Baryon Distribution vs. Mass Gonzalez et al. 2007 • Highest BCG+ICL fractions found in lowest mass systems. • Several possible interpretations • Selection biases potentially important “Intracluster” light can be efficiently generated in groups.
Total Stellar Mass • Luminosity Stellar mass • Using SAURON results • Luminosity-weighted M/L for L>0.25 L* • <M/LI> =3.6 for typical Schechter LF • Cautionary Notes • Use elliptical M/L for all galaxies • Assume same M/L for BCG+ICL Cappellari et al. 2006
Total Stellar Mass Steep decline in stellar baryon fraction with cluster mass. log(f*,500)= 7.57 - 0.64 log(M500) 1014 1015 Gonzalez et al. 92007) Gonzalez et al. (2007)
Total Gas Mass Gas masses from Vikhlinin 2006 • No overlap with our sample • More restricted mass range (augment at low mass with Gastaldello et al. 2006) log(f*,500)= 7.57 - 0.64 log(M500) log(fg,500)= -3.87 + 0.20 log(M500) 1014 1015 Gonzalez et al. (2007)
Total Baryon Fraction • Baryon fraction flat with mass Trade-off between stellar and ICM baryons. Star formation more efficient in lower mass systems Gonzalez et al. (2007)
Total Baryon Fraction • Total is 76% of WMAP value Possible Explanations Systematics X-ray mass & gas fraction (~15%) Zhang et al. data 85% WMAP Physics Simulations predict baryon depletion within r500 (~10%) Missing Baryons Must be independent of M500. No compelling evidence currently. WMAP Incorrect See McCarthy et al. 2006 Gonzalez et al. (2007)
Intracluster Light & Brightest Cluster Galaxies Counting Baryons Evolution of the Cluster Galaxy Populations What do our results imply for the origin of the intracluster light?
Conroy et al. 2007 Underlying Physics MBCG+ICL • A simple picture that works • Bulk of ICL from disrupted galaxies • >80% of stars in disrupted galaxies go into ICL • (Sat2Cen model in Figure) LICL/(LBCG+LICL) log (Msun)
Selection Bias? Stellar Baryon Distribution vs. Mass • Highest BCG+ICL fractions found in lowest mass systems. • Several possible interpretations • Selection biases potentially important “Intracluster” light can be efficiently generated in groups. Gonzalez et al. 2007
Selection Bias? Stellar Baryon Distribution vs. Mass • Highest BCG+ICL fractions found in lowest mass systems. • Simulations predict behavior similar to data “Intracluster” light can be efficiently generated in groups. Purcell et al. 2007
Intracluster Light & Brightest Cluster Galaxies Counting Baryons Evolution of the Cluster Galaxy Populations Does intracluster light lie on the fundamental plane? How can extreme systems shed light on galaxy structure? The Structure of Galaxies
The Fundamental Plane Basic Expectation: Virial Equilibrium s2+GM/re = 0 → s2 ~ (M/L)(Iere2)/re log re = 2 log s – log Ie – log (M/L) + C General Observation for Ellipticals • Very tight relation (Fundamental Plane, rms=0.085) • Tilted relative to virial expectation log re = 1.21 log s – 0.77 log Ie + C(Bernardi et al 2003) Does the cluster spheroid (CSph = ICL or BCG+ICL) obey a similar relation?
The CSph Fundamental Plane • Tight Correlation (rms=0.074 for BCG+ICL) • Smaller A than for ellipticals BCG+ICL +Galaxies BCG+ICL ICL Zaritsky, Gonzalez, & Zabludoff (2006a)
Comparison to other Spheroids Zaritsky, Gonzalez, & Zabludoff (2006a) • CSph (this work) • BCGs (Oegerle & Hoessel 1992) • E (Jorgensen et al. 1996) • E/dE (Matkovic & Guzman 2005) • E/dE/dSph (Bender et al. 1991) • dE (Geha et al.) log re = 2 log s – log Ie – log (M/L) + C
M/L variations • Too large for stellar populations • Not described by power law What is driving change in “A”? Zaritsky, Gonzalez, & Zabludoff (2006a) • CSph (this work) • BCGs (Oegerle & Hoessel 1992) • E (Jorgensen et al. 1996) • E/dE (Matkovic & Guzman 2005) • E/dE/dSph (Bender et al. 1991) • dE (Geha et al.) • dSph (assorted)
van den Bosch et al. (2007) Dwarf spheroids not included in fit What is driving change in “A”? Zaritsky, Gonzalez, & Zabludoff (2006a) Assume log M/L ~ (a log s – b)2 Not unique, but sufficient log re = -a2 log2s +2(1+ab)log s +B log Ie +C
The Fundamental Manifold rms = 0.099 (Not much worse than individual FPs.) dE E BCG CSph Zaritsky, Gonzalez, & Zabludoff (2006a) Fundamental Manifold Fundamental Plane
The other extreme… Zaritsky, Gonzalez, & Zabludoff (2006b) LG Dwarfs lie on same FM.
Towards a General Equation of Galactic Structure • Can we do something similar for allgalaxies? If we define V2= (1/2) vc2 + 2, for an isothermal sphere the virial eq. is: AV2=B GM/r which yields: log re = log V2 - log Ie - log L + log A - log B +C Assume all variation is in M/L rather than A,B and fit data for M/L. We use the Pizagno et al. (2006), Springob et al. (2007), Geha et al. (2006) spiral samples.
Large scatter in projection • Only 24% scatter about second order fit in log V, log Ie
log re = log V2 - log Ie - log L + log A - log B +C Use Cappellari et al. (2006) SAURON data to solve for constants Walker et al. (dSph) • Good agreement between dynamical and best-fit M/L Cappellari et al.
Reduced Equation of Galactic Structure Jorgensen et al. (1996) Springob et al. (2007) Scatter is 0.093 M/L is main driver for observed variation Other factors secondary (environment, AGN, accretion history,…)
Summary and Conclusions Intracluster Light & Brightest Cluster Galaxies Counting Baryons Chemical Enrichment of the ICM Evolution of the Cluster Galaxy Populations The Structure of Galaxies