Download
1 / 68
680 likes | 800 Views
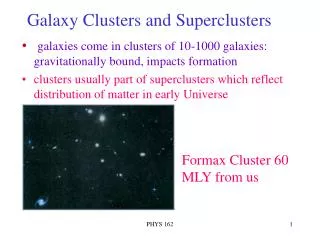
Environmental Influences on Galaxy Evolution and the Building of Galaxy Clusters. Alan Dressler Carnegie Observatories STScI -- April 13, 2005. …focusing on the evolution of disk galaxies since redshift z = 1. My collaborators, the “Morphs” group

E N D
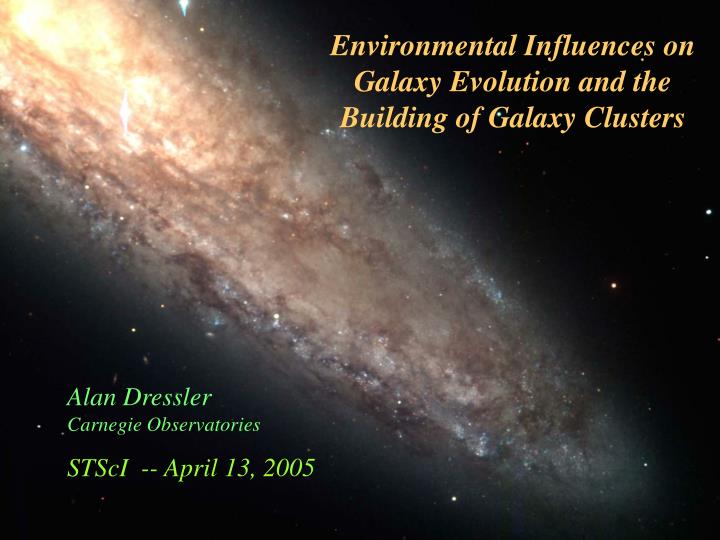
Environmental Influences on Galaxy Evolution and the Building of Galaxy Clusters Alan Dressler Carnegie Observatories STScI -- April 13, 2005
…focusing on the evolution of disk galaxies since redshift z = 1 My collaborators, the “Morphs” group Gus Oemler, Carnegie Observatories Bianca Poggianti, Padova, Italy Ian Smail, U. of Durham, UK Warrick Couch, U. New South Wales, Australia Richard Ellis, Caltech The Morphs have studied a sample of 10 clusters of galaxies at z ~ 0.5, a lookback time of ~5 Gyr. We have Hubble Space Telescope WPFC2 images for classification and spectra of about 600 galaxies.
Topics to be covered in this talk: • Demonstration that not only the rate of star formation, but its character – the importance of starbursts – has been changing dramatically since redshift z=1. Starbursts were more the norm. • Show evidence that starbursts are triggered by tidal encounters and mergers and argue from one case study, Abell 851 (z = 0.41) that these are triggered as clusters are built from infall. • Describe an instrument well suited for studying the outskirts of galaxy clusters: IMACS on the Magellan-Baade Telescope • Introduce the ICBS (IMACS `Cluster Building’ Survey)
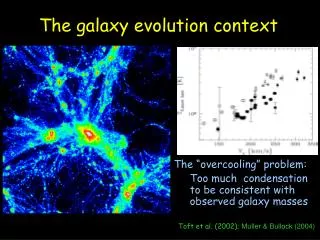
From GOODS -- Giavalisco et al. 2004, ApJ 600, L103 The sharp decline in star formation rates since z=1 is even more striking if only luminous galaxies (L*+2) are considered.
Measuring the star formation history per comoving volume, as first introduced by Mike Fall and Y.C. Pei (1995 ApJ 454, 69) and Madau et al. (1996 MNRAS 283, 1388) was a breakthrough step in understanding the history of turning gas into stars on a cosmic scale. Although much of the focus since then has been on pushing back to the earliest epochs, the precipitous decline in star formation rates since z=1 was also a very interesting and surprising result (cf. expectations developed in the 1970s (Twarog & Twarog, Tinsley & Larson, etc.) that persisted through the 1990s). This decline may be little more than an inevitable “running out of gas”, perhaps accelerated in a non-zero-lambda universe. To move beyond this generic picture, understanding what has happened in detail benefits from looking at the history of star formation in different types of galaxies and asking how it has been affected in the last 6-7 Gyr. Clearly, the Butcher-Oemler effect is a prime example of that evolution.
A new technique for comparing cluster populations: composite spectra made from adding together subsets (or all) of the spectra from a cluster or a sample of clusters. “Studying the Star Formation Histories of Galaxies in Clusters from Composite Spectra” Alan Dressler, Augustus Oemler, Jr., Bianca Poggianti, Ian Smail, Scott Trager, Stephen Shectman, Warrick Couch, and Richard Ellis, 2004 ApJ 617, 867. Motivation: Try to overcome the difficulty of comparing galaxy populations in different clusters based on analyses of individual spectra, many of which are marginal quality, S/N ~ 10, and the additional problem that various studies adopt different systems of spectral classification.
What happens if you co-add a representative sample of all the galaxies in clusters at z ~ 0.5 and z ~ 0 and compare? In the composite spectrum, K-type spectral features will show the fractional representation of “old” (τ > 3 Gyr) stars, [O II] strength will measure the rate of ongoing star formation, and Balmer absorption, specifically Hδ, will indicate the fraction of intermediate age stars, which is pumped up over normal levels by recent starbursts in the collective population.
Composite spectra for 12 present-epoch clusters and 8 intermediate-redshift clusters – typically 30-60 galaxies coadded per cluster Spectra are normalized, then luminosity-weighted and summed [O II] Hδ 5 clusters (8 total) z ~ 0.5 Morphs sample 5 clusters (12 total) z ~ 0 Dressler-Shectman sample
The continuum around Hδ changes substantially with increasing age, which complicates its measurement – the customary bandpass technique runs into problems. Fitting the Hδ line profile is more reliable. Both at Τ = 12 Gyr Variation with age
Recipe for a cluster at z = 0.5 (from the Morphs cookbook) Starbursts! About 30% of the population!
Couch & Sharples, 1987 MNRAS, 229, 423 Poggianti et al (1999 Ap 518, 576) show that spectra with Hδ > 6Å are unambigiously the result of starbursts – this is about 1/3 of the strong-Hδ sample in the Morphs rich clusters (about 100 galaxies with strong Balmer lines). But at least an equal number of those with Hδ < 6Å are decaying starbursts. So, at least 2/3 of the population could be post-starburst, rather than post-truncation (and starvation is too slow).
...a remarkable change in the amount and character of star formation in the recent past. In rich clusters of galaxies, but even in “the field,” the mode of star formation appears to shift to a much greater fraction which are starbursts (20-30%) The disappearance of starbursts appears to be cosmic evolution rather than cluster specific (no evidence for variation cluster-to-cluster).
Las Campanas Redshift Survey: 1 in 10 Dressler-Shectman nearby clusters Liu & Kennicutt nearby mergers 2+ σ limits A851 (z=0.41) cluster members field galaxies 0.35 < z < 0.55 Conclusion: Starbursts are a common mode of star formation at z ~ 0.5, both in and out of clusters
According to these early data, both in clusters and the field, intermediate-redshift galaxies seem to have a much stronger propensity for strong starbursts than today. Is this an extension to higher luminosities what is seen in some present-epoch dwarf galaxies? Given the timescale for this phenomenon, and the significant percentage of the population (10-30%) that seems to be involved, one might speculate that earlier than z = 1 we will find no continuously-star- forming spirals like the Milky Way. Gallart, Aparicio, & Freedman
Strong Balmer line galaxies are mostly disk galaxies. A significant amount of ongoing star formation could be hidden (Glenn Morrison’s work on radio continuum detections) Could these starbursts in disk galaxies have something to do with the production of S0 galaxies since z ~ 1 to the present? Probably. k+a (and a+k) – post starburst e(a) – with weak emission: dusty starbursts! (See also Fadda et al. 2000 A & A – ISO detections in Abell 1689)
In Dressler et al (1997) the Morphs claimed that there is a striking deficiency of S0 galaxies in intermediate-redshift compared to environments in present-epoch. If true, this is critical for understanding the fate of the infalling, star-forming galaxies. Present-epoch morphology/density relation …Morphs clusters at z ~ 0.5. Comparing at the same galaxy density (which is important), ellipticals represent an equal (or even greater) percentage of the cluster population. The big difference in the 2 diagrams is the paucity of S0 galaxies compared to today’s clusters. Two new studies by Smith et al. (2005 ApJ, 620, 78, and Postman et al. (2005 astro-ph 0501224) push this back to z = 1: both conclude that the paucity of S0s at intermediate redshift is real.
Environmental influences on galaxies • Galaxy-galaxy collisionsstripping, a la Baade & Spitzer • Ram pressure stripping – Gott & Gunn, Abadi, Moore, & Bower… • Starvation (removing gas-rich halos) – Larson, Tinsley, & Caldwell, Bekki et al • Mergers, accretions, tidal interactions – Toomre, Mihos (driving secular evolution? – see Zhang 1999 ApJ 518, 613) • Evaporative gas removal – Cowie & Songaila, Nulsen • Harassment – Moore et al. It seems notable that in the 1970’s, global processes like ram pressure stripping were nearly exclusively cited for environmental changes such as the rarity of spirals in clusters – they still are, despite growing evidence that they are not the dominant factor. What has changed is the advent and acceptance of hierarchical clustering.
What triggers the starbursts? Exploring the outskirts of Abell 851 (z = 0.405) Image by Kodama & Smail
ROSAT HRI image of Abell 851 (Schlinder & collaborators)
Dressler-Shectman subclustering test (1988, AJ 95, 985) North group – filled circles; northeast group – stars
Abell 851 and the Nature of Starburst Galaxies in Intermediate Redshift Clusters 2005, Oemler, Dressler, Poggianti, Smail, Morrison, Kelson, Trager, Couch, & Ellis –soon to be submitted.
Spectral types of 113 cluster members in A851 44 new members at R ~ 1 Mpc -- outside of the original Morphs field (from a sample of 101 new spectra with redshifts from COSMIC on 200” Hale telescope) HST WFPC2 fields starbursts
HST + X-ray contours from Rosat “il tripico” – three members of a small infalling group, two with strong Balmer absorption, one with very strong emission (starburst) 3 megaparsecs ΔV = 2214 km s-1 σ = 280 km s-1
Excluding passive galaxies (old stellar populations), “active” galaxies – those with substantial Balmer absorption or [O II] emission – are different in field and cluster, as previously found by Morphs and others. Post-starbursts – Balmer absorption but little or no [O II] – are almost exclusively found in clusters. Why? Starbursts occur in both cluster and field, but star formation after the burst is apparently quenched in clusters. The bursts themselves are enough to exhaust the gas, but field galaxies seem able to refuel. Possible mechanisms: intermediate-z field A851 • gas stripping • starvation • harassment (maybe)
Mostly, OII and radio continuum emission track, but there are some strong post-starbursts that have strong radio and little or no OII – some are buried (1/2 of active starbursts, 1/4 of post-starbursts. However, after the discovery of SCUBA sub-mm sources, the question was raised by Smail & collaborators whether most or all of the apparently post-starburst galaxies could have buried starbursts (although why this would only occur in clusters as opposed to the field is not clear). Radio continuum (VLA) observations by Glenn Morrison in A851 and other clusters show that a significant number of post-starbursts might have buried star formation, but only about ~20-30%.
Post-starburst galaxies with detectable continuum radio flux …and those without Hδ width is twice as large in radio-detected galaxies. These starbursts are significantly younger, and significant star formation may be hidden and ongoing.
Galaxies with the strongest Hδ absorption in A851 radio emission no [O II] with [O II] no radio emission
Spatial distribution by spectral type Starburst population small open circles: k+a large open circles: k+a small stars: e(a) large stars e(b) “Normal galaxies” small filled circles: k-type diamonds: e(c)
Spatial distribution by: morphological type -- (mergers, strong tidal interaction) radio activity Solid points are radio emitters Solid points are M & T types
Spatial distribution by age of starburst This analysis done by coadding each galaxy with its two nearest neighbor starbursts to increase S/N “Normal galaxies” small filled circles: 7.0 < Hδ < 9.0 Å large filled circles: Hδ > 9.0 Å
only 2 k-type and no e(c)’s! 6 are e(a), 1 k+a The emerging picture seems to be that as gas-rich disk galaxies fall into these rich clusters, either individually or in small groups, they are severely jostled by tidal interactions with each other and their new neighbors. This seems to give rise to starbursts and effectively ends their lives as spiral galaxies, leaving most as burned-out S0 galaxies. The suburbs of A851: 7/9 are starbursts!
The infalling group or filament, at the redshift of A851, cold (σ ~ 200 km s-1), far away from the clusters core (~2.5 Mpc) and full of starbursts. KPNO ground-based image from Morrison
After several failed proposals to extend HST coverage beyond Cycle 6 mosaic, Cycle 14 proposal by Dressler & Oemler for 2 orbits to cover the NW filament that is dominated by starbursts.
Strengths: Abell 851 is one of a small number of intermediate redshift clusters that is well imaged out to near the turnover radius of the cluster. If authors are correct in their hypothesis that the infalling groups to be observed catch the Butcher-Oemler effect events in action, this relatively small amount of observing time relative to the A851 HST study in Cycle-6 and to studies of the B-O effect in clusters, could add a significant amount to our understanding of this effect. The investigators are experts in the analysis of cluster data. Weaknesses: It was unclear how they classified objects into "M" Merger class or "I" Interaction class? What objects have tidal tails but do not seem to be interacting with a neighbor? No quantitative methods of determining classes of interaction were discussed. Not all objects that are interacting show tidal features or will be obvious in optical images. Only retrograde encounters produce tails, etc. Dust can be a problem. That a merger induces star formation has been known for a long time. The [OII]/H-alpha (and therefore H-delta) ratio decreases with low and high metallicity, but this probably is not the whole story.
In summary, we believe that the major evolutionary effect that is going on in clusters since z = 1 is the infall of spiral galaxies, most in small groups, in which merging and interactions drive starbursts that push these galaxies along the path to S0s. The idea that significant environmental effects in disk galaxy evolution happen in relatively moderate-density environments, far from clusters cores, has been gaining popularity. There has been quite a lot of evidence of this for at least 20 years.
Sloan Digital Sky Survey result Critical Density: 1 galaxy per h2 Mpc-2 Morphological fraction 75th SFR-density Morph-radius Sc 25th C4 Clusters median SDSS sees a dramatic decrease in the strongly star-forming Sc galaxies: in-fall regions of clusters Surface density (10th NN) in a redshift slice (pseudo 3D density) Mpc-2
Kodama, Smail, Nakata, Okamura, and Bower “The transformation of galaxies within the large-scale structure around a z =0.41 cluster” (2001 ApJL, 562, L9) -- Suprime-Cam imaging of Abell 851 “The depth of or observations, combined with the identification of filamentary structure…We find an abrupt change in the colors of L < 0.1L* galaxies at a local density of 100 galaxies Mpc-3, with the population in lower-density regions being predominantly blue while those in higher density subclumps are red. The transition in color-local density occurs at densities corresponding to subclumps within the filaments surrounding the cluster.
Present-epoch morphology/density relation (Dressler 1980) Commonly taken as yet more evidence of the importance of ram pressure stripping in the conversion of spirals to S0’s …but not by me. I suggested that a relationship like this, such a slow function of density, must have arisen at early times when the density contrast was much smaller. And, most S0 galaxies are in the field! Same at z ~ 0.5
Postman & Geller 1984, ApJ, 281, 95 Extending the morphology-density relation outside of rich clusters of galaxies out into low-to-moderate density groups Clear evidence that the extreme environment of a cluster core (e.g., ram pressure stripping) is not required to influence evolution of morphological type
Pisces-Perseus Supercluster Giovanelli, Haynes, & Chincarini 1984 ApJ, 300, 72
Distribution of all morphological types E,S0,S0a Sc, S Later than Sc Sa,Sab, Sb,Sbc
A new wide-field imager and spectrograph for Magellan: IMACS The Magellan Consortium: Two 6.5-m telescopes shared by Carnegie, Harvard, Arizona, MIT, and Michigan
IMACS – Inamori-Magellan Areal Camera & SpectrographA 5-year, $6M project of the Carnegie Observatories commissioned on the Baade (Magellan I) telescope in August 2003 IMACS is an imaging multislit spectrograph at the Nasymth focus. The challenge: move 1,000 lbs of optics with 6,000 lbs of steel and keep deformations to a few thousandths of an inch (for mirrors and gratings in the pupil, only a few microns!)
IMACS is ideal for imaging and spectroscopy of galaxy clusters. It is a direct-imaging spectrograph, not a fiber spectrograph Grating dispersers: 2000 < R < 12000 Also echellette mode R =25000 Grism dispersers: 1000 < R < 5000 27 arcmin Durham IFU 7” 7 15’ 5” 60” f/2.5 camera f/4 camera 2 x 1000 fibers 0.2” resolution 0.2” per pixel 0.2 sq deg Spectroscopy for up to ~700 objects per mask 0.11” per pixel 0.06 sq deg Similar to DEIMOS, VMOS ~ 200 objects per mask