Download
1 / 14
140 likes | 351 Views
Long Run Cost Curves. In the long run. A small plant that manufactures chairs will have its own short run cost curve If a firm expands and replaces its small plant with a medium size plant, it’ll move from one short run curve to another

E N D
In the long run • A small plant that manufactures chairs will have its own short run cost curve • If a firm expands and replaces its small plant with a medium size plant, it’ll move from one short run curve to another • There is a different short run cost curve for each given quantity of fixed factor • At first, each additional plant will only lower the overall long term ATC 2
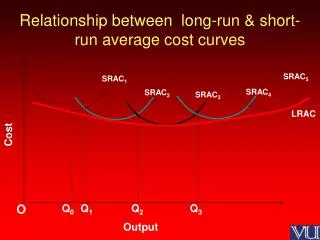
Long-Run Average Costs $ per Magazine Range A Range B Range C Quantity of Magazines per Week Costs in the Long Run (b)Figure 4.8, page 99 ATC in short run with large factory ATC in short run with small factory ATC in short run with medium factory AC4 AC1 Long-Run AC AC2 AC3 4
Why might the AC cost curves move downwards between AC1 and AC2 (from previous slide) • Example: • Suppose, for example, that Company X employs 1,000 workers in a 5,000 square foot factory to produce 1 million Stuffed Amigos • The company then expands to a 10,000 square foot factory employing 2,000 workers producing 2 million Stuffed Amigos. • Why might going from AC1 to AC 2 result in a lower production cost per unit?
Note: The law of diminishing marginal return does not apply in the long run because the fixed input is no longer fixed in the long term
Costs in the Long Run (a) • Long-run average cost is the minimum short-run average cost at every output • The long-run average cost curve is saucer-shaped because of various ranges of returns to scale • initial range of increasing returns to scale • middle range of constant returns to scale • final range of decreasing returns to scale 7
Long-Run Average Costs $ per Magazine Range A Range B Range C Quantity of Magazines per Week Costs in the Long Run (b)Figure 4.8, page 99 ATC in short run with large factory ATC in short run with small factory ATC in short run with medium factory AC4 AC1 Long-Run AC AC2 AC3 8
T 4, Returns to Scale (a) • All inputs can be changed by the same proportion in the long run • increasing returns to scale means the % change in output > the % change in inputs • constant returns to scale means the % change in output = the % change in inputs • decreasing returns to scale means the % change in output < the % change in inputs 9
Economies of Scale • Economies of scale is also another term that refers to the same thing • Increasing returns to scale = Economies of scale • Decreasing returns to scale = Diseconomies of scale 10
Returns to Scale (b) • Increasing returns to scale are caused by • the division of labor • working on fewer tasks allow workers to become proficient • specialized management • Managers can focus on developing and managing own department • Specialized Capital • Some machinery is only available to larger plants and is designed to produce mass number of units 11
Returns to Scale (b) • Decreasing returns to scale are caused by • management difficulties • Having too many departments will result in coordination and communication issues • limited natural resources • More applicable to fishing and forestry industries where such natural resources are limited, even in the long run
The long run ATC curve shows the lowest average total cost at which any output level can be produced after the firm has had time to adjust its plant size • In real life, there can be unlimited number of short run ATC curves. Therefore the long run ATC curve is much smoother.