Download
1 / 5
80 likes | 302 Views
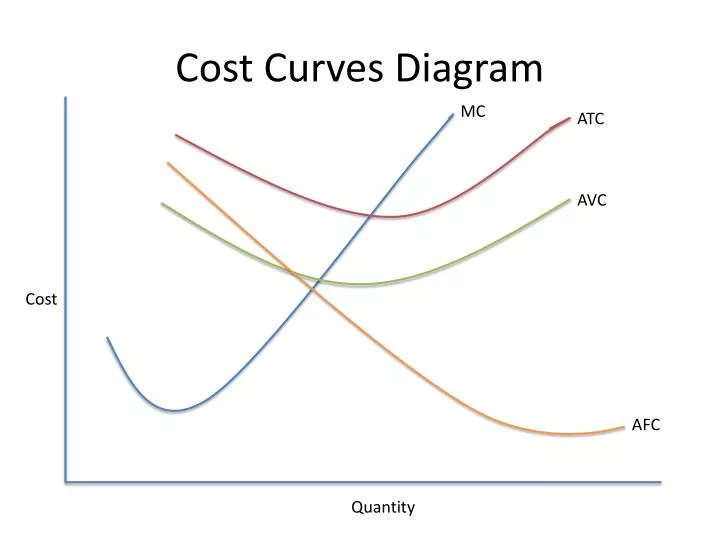
Cost Curves Diagram. MC. ATC. AVC. Cost. AFC. Quantity. LRAC Curve with SRAC Curves. SRAC5. SRAC1. SRAC2. SRAC4. LRAC. SRAC3. Cost. Quantity. Economics and Diseconomies of Scale. Economics of Scale. Diseconomies of Scale. Cost. Constant Return to Scale. Quantity.

E N D
Cost Curves Diagram MC ATC AVC Cost AFC Quantity
LRAC Curve with SRAC Curves SRAC5 SRAC1 SRAC2 SRAC4 LRAC SRAC3 Cost Quantity
Economics and Diseconomies of Scale Economics of Scale Diseconomies of Scale Cost Constant Return to Scale Quantity
Shut Down Price and Break-Even Price MC ATC Cost AVC P1=ATC breakeven price P=AVC shut down price Quantity
Abnormal Profit and Normal Demand MC AC Cost D=AR MR Quantity