Download
1 / 29
300 likes | 492 Views
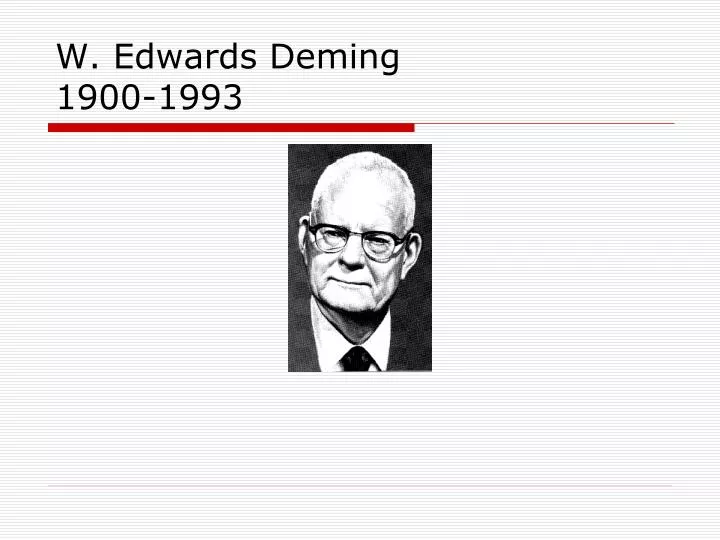
W. Edwards Deming 1900-1993. Supply Chains. Exhibit 3.1 Generic Supply Chain Model. Costs and the Value Chain. The Value Chain is a model of the way processes are linked together. It identifies all of the parts of the supply chain that add value.

E N D
Supply Chains Exhibit 3.1 Generic Supply Chain Model
Costs and the Value Chain • The Value Chain is a model of the way processes are linked together. • It identifies all of the parts of the supply chain that add value. • All value is added through processes, but all costs are not.
Quality . . . What do we mean??? • Quality is defined by the customer. • Quality has a key role in customer perception of value. Quality= Conformance to customer specifications and expectations.
Dimensions of Product Quality* • Performance • What are the desirable characteristics of the product? • Features • What additional characteristics of the product are possible? • Reliability • Is the product dependable? Does it accomplish what it promises? • Durability • How long will the product last? *Source: Garvin, D.A. (1984) and Pisek, P.E. (1987)
Dimensions of Product Quality* • Serviceability • Can the product be easily and inexpensively repaired? • Aesthetics • Does the product satisfy subjective requirements? • Response • Is the interaction between the customer and the product provider pleasant and appropriate? • Reputation • What does information on past performance say about the company? *Source: Garvin, D.A. (1984) and Pisek, P.E. (1987)
Dimensions of Service Quality • Reliability • Does the business keep its promises? • Responsiveness • Does it promptly respond to the needs of its customers? • Assurance • Can the employees generate customer trust and confidence?
Dimensions of Service Quality • Empathy • Are employees approachable and sensitive to individual customers? • Tangibles • Do the physical facilities, equipment, and written materials show care and attention?
A Brief History of Quality Management • Deming:Stressed that significant quality improvement only comes from changing the organization, and that responsibility rests with upper management. Deming’s 14 Points
Cost of Quality • All of the costs associated with maintaining the quality of goods and services. • Those costs are reduced as failures are moved closer to the firm and ultimately prevented.
Total Quality Management • TQM devlops a culture of “doing it right the first time.” • It is based on three principles: • Customer focus: The customer determines what quality is. • Continuous process improvement: Constantly trying to eliminate variability. • Total involvement: A commitment at all levels of the firm.
How TQM Accomplishes Its Principles 3 PrinciplesOf Quality TQM’ssupportiveapproaches
Total Quality Management’s Impact on Profitability Insert exhibit 6.9 (Impact on profitability)
General-Purpose Quality Analysis Tools • Process Maps • Run Charts • Cause & Effect Diagram • Pareto Charts • Histograms • Check Sheets • Scatter Diagrams • Control Charts
General-Purpose Quality Analysis Tools:Process Maps • A visual representation of a process. • A Process Map for an Internet Retailer
General-Purpose Quality Analysis Tools:Run Charts Run Charts: Plotting a variable against time.
Machine Man Effect Environment Method Material General-Purpose Quality Analysis Tools: Cause & Effect Diagram Possible causes: • Can be used to systematically track backwards to find a possible cause of a quality problem (or effect) The results or effect
General-Purpose Quality Analysis Tools:Cause & Effect Diagram Also known as: Ishikawa Diagrams Fishbone Diagrams Root Cause Analysis
Data Analysis Example Exhibit 7.6: SleepCheap Hotel Survey Data
General-Purpose Quality Analysis Tools:Histogram • Can be used to identify the frequency of quality defect occurrence and display quality performance
General-Purpose Quality Analysis Tools:Pareto Analysis • A Variant of histogram that helps rank order quality problems so that most important can be identified 50.5% of complaints are that something is dirty 63.5% of complaints are about the bathroom
General-Purpose Quality Analysis Tools:Checksheet Monday • Can be used to keep track of defects or used to make sure people collect data in the correct manner • Billing Errors • Wrong Account • Wrong Amount • A/R Errors • Wrong Account • Wrong Amount
General-Purpose Quality Analysis Tools: Control Charts • Can be used to monitor ongoing production process quality and quality conformance to stated standards of quality