Download
1 / 46
470 likes | 484 Views
Managing the Waikato River. Julian Williams Tony Petch Advancing co-management. Environmental and cultural goals. Intrinsic values Water quality and quantity Fisheries Cultural values Kiingitanga Tikanga/Kawa Te Mana o te Awa Mana whakahaere Enabling social and economic wellbeing

E N D
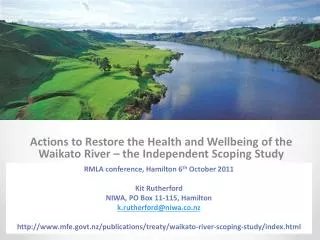
Managing the Waikato River Julian Williams Tony Petch Advancing co-management
Environmental and cultural goals • Intrinsic values • Water quality and quantity • Fisheries • Cultural values • Kiingitanga • Tikanga/Kawa • Te Mana o te Awa • Mana whakahaere • Enabling social and economic wellbeing • Energy generation, irrigation, water supply • Contact recreation, amenity • Recreational and commercial fishery • Transport, industry
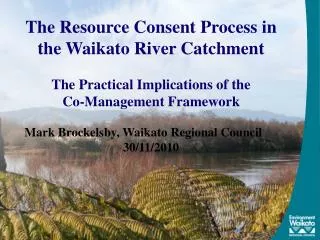
Waikato-Tainui • “To protect and restore the health and well being of the Waikato River for future generations” • Waikato Tikanga and Kawa • … the Waikato River is degraded and should not be required to absorb further degradation… • Restoration of water quality within the Waikato River so that it is safe for people to swim in and take food from… • To strengthen the relationship between the tribe and the Waikato River
Environment Waikato policies • RPS (under development) • All water bodies healthy and the mauri protected (support water recreation, habitat and food spp.) • Highlight and protect outstanding water bodies (~10% of all water bodies) • Good riparian management everywhere • Non-point source nutrient reductions in priority catchments where values of water are at risk (Waikato-Waipa already selected)
NPS for freshwater • Maintain, restore and enhance intrinsic values of water • while… • Providing for social, economic and cultural wellbeing • Tangata whenua involved and Maori values and interests provided for… • Improve integrated management of freshwater… • Safeguard life-supporting capacity, ecosystems process and indigenous ecosystems • Phase out over allocation of water • Protect the quality of outstanding freshwater…enhance the quality of all fresh water contaminated…
Main issues to manage • Nutrients N, P • Microbes • Sediment • Indigenous fishery
Sources of nitrogen entering streamsin the Waikato region Niwa data
Sources of nitrogen entering streamsin the Waikato region Niwa data
Sources of microbes entering the Waipa River • Sewage • Te Kuiti, Otorohanga, Te Awamutu, Te Kowhai • Industry • Meat works • Dairy factory • Farm land • 0.1% to 10% of river microbes from point sources
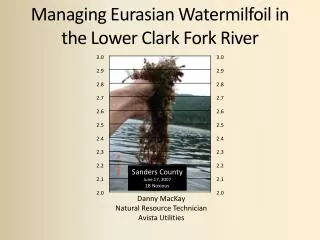
Factors impactingthe indigenous fishery Photo:Ben Chisnall, NIWA
Factors impactingthe indigenous fishery • Serious decline • Dams, culverts, riparian vegetation, wetlands • Commercial fishing Photo:Ben Chisnall, NIWA
Water quality trends in the Waikato River between 1989 and 2008
Actions to maintain water quality • Parameter • Phosphorus • Microbes • Sediment • Actions • Riparian fencing and planting • Soil conservation • Catchment control schemes • River stabilisation • Cost • $144 m Tainui • $111 m Maniapoto
Actions to maintain water quality Fishery Tuna Piharau Actions Protect current wetlands and create new wetlands (10,000 ha) Restore connection to habitat (culverts) Fish passage and transfer over dams Riparian shading (covered in sediment control) Cost $202–242 m Tainui (carbon forests in headwaters) $22.5 m Maniapoto (carbon forests in headwaters) • Kokopu • Köaro
Actions to maintain water quality • Nitrogen • To maintain N load • Enhanced good practice to reduce leaching to 30/12 kg/ha/y (10 % reduction in gross margin)…Or • Reduce dairy area by 25,000 ha and remaining farms capped at current average practice 36/13 kg/ha/y • To reduce N load • Further reductions of off-farm N loss (production affected) • Further reductions in dairy area
Change in nitrogen load from land use conversion and intensification to 2030 Conversions, dairy intensification No conversions, dairy intensification Conversions, farms capped 36/13 Conversions, farms capped 33/12 ‘achievable good practice’ Conversions, farms capped 30/12 ‘enhanced good practice’ • Change (%) • 52 • 33 • 13 • 6 • 0
Gross margins v kg N leached 4500 50 45 4000 40 3500 35 Gross margin ($/ha) Nitrate leached (kg/ha) 3000 30 GM $/ha 2500 25 N loss kg/ha 2000 20 No N at all Lighter Jersey herd No N except effluent Cows on pad 60 days No winter N, 200kg N/ha Base + land disposal effluent Cows on herd home 60 days DCD, annual effect +6%, all in Ju... Base: cows wintered on crop on ... Herd off-farm 60 days, no forage ... Base Farm at Optimum stocking... No N applied in winter, shifted to... Pad247, NoWintN,DCDNoCrop2...
Actions to maintain water quality Parameter N Actions Application of best practice Reduced area of pasture (conversion to forests) Costs Best practice - Up to $300 /ha/y - $100 m Land conversion - $100-200,000 per tonne N leached (2000 t over 20 y) Waikato-Waipa river system - $400 - $800 m
Sharing the burden of change RMA s36 requires examination of contributors and beneficiaries of the work proposed LGA 2002 requires the following factors be considered when funding an activity how the activity achieves community outcomes the distribution of benefits among the community and individuals the period over which the benefits accrue the extent to which actions or inaction of individuals or groups cause the need for the work the costs and benefits, including transparency and accountability, of funding an activity distinctly cf. general rate
Sharing the burden of change RMA S85 prohibits compensation claims arising from the effect of planning restrictions, except where land becomes incapable of reasonable use “In upholding the need for environmental protection, property rights must not be discounted or undervalued…”PA Joseph Univ of Canterbury Some sharing of burden of change anticipated
Examples Taupo model National 45%, Region 22%, District 22% Mix of targeted and general rate 15 year transition Rainfall ‘tax’ Upstream landowners - 2% contributor rate ($1 /ha) and 2% indirect benefit rate ($1 /ha) Downstream land owners – 96 % indirect and direct rate ($50-150 /ha) Appealed to high court and appeal court - important precedent
Examples Waikato-Tainui Raupatu River Settlement $210 m ~25% of the true costs Land owners expected to make change Local government expenditure to continue if not increase (additional $500,000 this annual plan) Agencies expected to bear certain costs 30 year transition
Pathway forward • Agree desired environmental quality • Maintain water quality as a minimum • Agree time frame for land use change • Time to make the necessary change is important to minimise economic and social impact • Ensure burden of change is acceptable to community • Examine the exacerbators and beneficiaries of land use change • Agree any transitional support necessary • If necessary determine funding splits between nation, region and local community
Waikato-Tainui Initiatives • To achieve overarching purpose and Waikato objectives • Waikato-Tainui Initiatives • Tribal Co-management Training • Sites of Significance project • Nursery programme • Fisheries restoration programme including Aquaculture • Energy efficiency programme • River restoration projects and research • Tribal and Community training and education • Implementing traditional practices based on tikanga • Waikato-Tainui to receive River Initiatives Fund = $50 m
Costs to associated parties • Many parties have responsibility for managing the Waikato River or are major users of the River. These agencies are expected to bear some costs • These costs may include: • Employment of extra personnel i.e. Fisheries Officer • Staff time and commitment • Improving practice as a result of policy changes • Waikato-Tainui recognise these costs, but believe the benefits far outweigh the costs
Tools • Information • Extension, works and services • Voluntary agreements • Fonterra Accord • Financial incentives • Clean Streams • Market based Instruments • Resource rentals, taxes • Cap and trade systems • Regulation • Taupo, Rotorua…Upper Waikato…
Section 70 paraphrased • A permitted activity rule on its own or cumulatively cannot allow: • Conspicuous change in colour or clarity • Floatable scums etc • Objectionable odours • Significant adverse effects on aquatic ecosystems • Water to become unsuitable for stock water supply
Examining the tradeoffs • Two issues • How is the Waikato economy affected by change in land use? • What are the transition costs (and benefits)? • Waikato economic model (input/output) • Assists debate on tradeoffs between • different land use scenarios • environmental performance • impact on the regional economy and employment
The scenarios • Gross margins reduced by 10% for farms in the Waikato-Waipa catchment to assess the impact of enhanced best practice • Retain current gross margins but reduce area of dairy land by 25,000 ha by converting to over 20 years (the limit of the model is year 2031) • Note - Land is grazed as sheep and beef units for 5 years before being planted
Results • Water quality maintained at 2000 levels • Scenario 1 after 20 years • GRP is 4% lower ($960 m) than unrestrained base scenario (2.3 years behind base case) • Employment 0.9% lower • Scenario 2 after 20 years • GRP is 3.7% lower ($870 m) than unrestrained base scenario (2.1 years behind base case) • Employment 1% lower • Carbon credits from new forests are worth $280 m: $14 m per year
Transitions costs: • The examination of trade-offs requires additional analyses to examine • cash flow and capital flows • cost benefit analyses to examine the effect of land use changes • This work is underway with MAF Policy, Hamilton • Transition costs include; • costs of converting dairy pasture to forest, • lost land value, • redemption of Fonterra shares, • changes in employment structure, and stranded capital arising from land use change, • offset by forestry development, carbon credits and other environmental benefits
Tribal costs to reach settlement • Costs to date for Waikato-Tainui up to settlement date - $8.5 m • Protecting the integrity of the Settlement e.g. resource consents • Legal costs • Negotiation costs • Staff and Administrative costs • Reimbursed $2.8 m, therefore monetary cost to tribe = $5.7 m
Tribal Costs to implement settlement • Co-Management for Waikato River • Participation in Policy development • 1 Regional Policy Statement and Regional Plan • 4 District Plans • 5 LTCCPs • 1 Conservation Management Strategy • Participation in River Related Consents • Development and implementation of Joint Management Agreements x 5 • Development and Implementation of Accords x 11 • Co-management of lands • Consultation with 67 marae • Waikato-Tainui to receive $1 m per year for 30 years for co-management arrangements