Download
1 / 12
120 likes | 245 Views
YES Youth Organization. SPSS Statistical Analysis.

E N D
YES Youth Organization SPSS Statistical Analysis
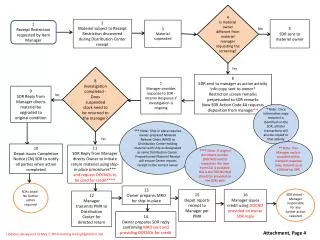
This analysis was created by taking raw data from our Access database, converting it to an SPSS statistical file, generating statistical output from that file, and then displaying these outputs through a Powerpoint presentation. This presentation will be available on the YES website through a Frontpage application. The analysis is designed to illustrate relationships between the training received at YES and the job placement dynamics YES strives to achieve for its clients. Analysis includes: Frequency Distributions Histograms Cross Tabulations Scattergrams Correlation Regression Analysis SPSS Statistical Analysis
Statistical Frequency Distributions by Variable These statistics measure the mean, median, standard deviation, and range of our variablesfor the clients of YES. This table illustrates the middle range for the progress we have achieved. We will see this distribution illustrated through histograms in the next slides.
Histogram of the Distribution of Hourly Wages Among YES Clients
Relationship of Hours of Training to Hourly WageAnalysis of the relationship of number of training hours to hourly wage for clients of the YES organization shows a stronger positive relationship tan GPA
Relationship of GPA to Hourly WageAn analysis of the relationship between Grade Point Average (GPA) of clients enrolled in YES Programs found that there is a positive association between GPA and Hourly Wage (entering students with higher GPA did earn higher hourly wage on average.
Cross Tabulation Test GPA to Hourly Wage This Cross Tab Test shows a Chi-Square of 174.7 and a P value of .000, revealing a significant relationship between GPA and Hourly Wage.
Cross Tabulation Test Hours of Training Finished to Hourly Wage This Cross Tab shows a Chi-Square of 1371.4 and a P value of .000, revealing an even stronger significance between training and hourly wage than for GPA(last slide).
Statistical Correlation Shows correlation of the six variables of YES clients: GPA, Hourly Wage, Hours/Week, Hours Training, Previous Years Education, and Skill Level. A positive number reveals a positive correlation ranging from 0 to 1. The closer this number is to 1, the stronger the correlation between the two variables.
Regression Analysis: Hourly Wage A regression analysis is a way of analyzing how strongly the independent variables affect the dependant variable. A regression equation can be written from this statistical analysis illustrating this. Regression Equation Y(wage)=2.615+.069x(gpa) + .420x(hrstr) + .154x(ed) + .388x(skill) Hours of Training represents the strongest effect on Hourly Wage at .420.
Regression Analysis: Hours Work/Week Regression Equation Y(hrs/wk)= 22.22 - .103x(gpa) + .178x(hrstr) + .219x(ed) + .402x(skill) Skill level represents the strongest effect on Hrs/Wk at .402.