Download
1 / 18
190 likes | 372 Views
Population Density and Growth. Distribution of people on Earth. Terminology. Population Density Population density is a measure of how compact or concentrated a population is. It takes area of land into account as well as population.

E N D
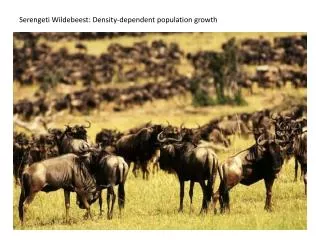
Population Density and Growth Distribution of people on Earth
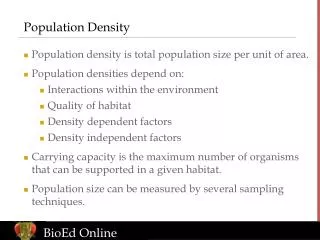
Terminology • Population Density Population density is a measure of how compact or concentrated a population is. It takes area of land into account as well as population
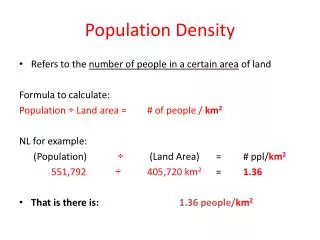
Population Density = population per unit area (unit area is usually measured in Km2) • Sparsely populated = small number of people per unit area • ( less than 100 people / Km2) • Densely Populated = high number of people per unit area • (higher than 100 people / Km2 ) • It is important to note that these two classifications and the numeric cut off of 100 people / Km2
Global Patterns of Population Density • North America: • Sparsely populated in north, • Densely populated along North eastern U.S. and south western U.S. • South America: • Sparsely populated in Center, • Densely populated along Western Coast But most dense south Eastern Brazil • Europe: • Sparsely populated in Extreme North, • Densely populated throughout remainder • Asia: • Sparsely populated in North & center, • Densely populated in South East • Africa: • Sparsely populated in Sahara, • Densely in North & Sub Sahara
Factors affecting Population Density and Distribution 1. Climate: • Warmer comfortable climates attract people. Notice that most people live in a moderate climate region.
2. Economics: • Population distribution has changed over time. No longer are dense populations around primary resources. Urbanization and the move to the industrial and now the information ages have changed population distribution. 3. Transportation: • Coastal regions attracted business and people because of ocean transportation. It was true for initial settlement and is still true today. Most major cities are located on the coast.
Population Growth Rate • Generally it is a measure of "how fast is the population growing?" • It is measured as the percentage increase in a population over a period of time. • The calculation used to provide a measure is known as the Annual Growth Rate (AGR) • The formula is • AGR = pop. change x 100% ÷ years for change pop. original
How Fast is Fast? • Most population statisticians recognize three categories of growth rates. They distinguish among slow, fast and moderately growing populations. • Fast growing: AGR > 2% • For example Mexico, between 1971 & 1981, had a fast growing population with an AGR of 4.7% • Moderately growing: AGR approximately = 2% • Slow growing: AGR < 2% • For example Sweden, between 1971 & 1981, had a slow growing population with an AGR of 0.5%
Trends in population growth rates • Most countries population growth rates are declining. Especially developed nations. As we will see in the next lesson generally speaking the more developed the nation the more stable the population. • This trend towards lower growth rates should not be confused with decreasing populations. The worlds population is still growing at a phenomenal rate. Look at figure 18.6 and you can see that we still increasing the world's population very fast. • Note: developed nations have lower AGR
Demographic Transition • is a model that describes population change over time. It is based on an interpretation begun in 1929 by the American demographer Warren Thompson, of the observed changes, or transitions, in birth and death rates in industrialized societies over the past two hundred years or so.
STAGE ONE • associated with pre Modern times, and is characterized by a balance between birth rates and death rates. This situation was true of all human populations up until the late 18th C. when the balance was broken in western Europe. For example we would expect that native/tribal populations that exist in isolated parts of the world might still exist in the stage where birth rates are high and death rates are high.
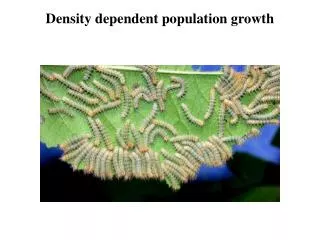
STAGE TWO • sees a rise in population caused by a decline in the death rate while the birth rate remains high, or perhaps even rises slightly. This would be the case in lesser developed and developing nations where there is enough health care and nutrition decrease death rates but birth rates are still high.
STAGE THREE • moves the population towards stability through a decline in the birth rate. This would be the case in developing countries and those that have recently become developed nations
STAGE FOUR • is characterized by stability. In this stage the population age structure has become older. For example Canada, Sweden and other developed nations would be in this stage of the model.