Download

1 / 25
250 likes | 364 Views
Population distribution, density, and data. Before we begin…. MDC: More developed country LDC: Less developed country What makes a country developed? Education, health care, government, safety Name some countries that would be MDCs and name some LDCs. Arithmetic Density.

E N D
Before we begin… • MDC: More developed country • LDC: Less developed country • What makes a country developed? • Education, health care, government, safety • Name some countries that would be MDCs and name some LDCs
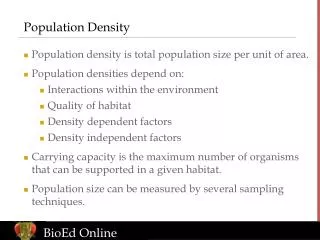
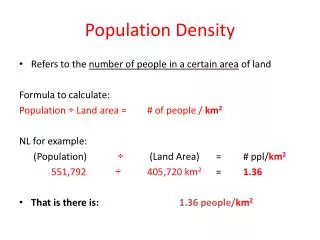
Arithmetic Density • Most often used • Total number of objects in an area • People per square mile or kilometer • Why is it important to talk about population density rather than just population?
1 million people 1 million people
Physiological Density • The number of people supported by a unit area of arable land • What do we mean by unit area? • What does arable land mean? • This is more about food and the land’s ability to support a population
Agricultural Density • The ratio of the number of farmers to the amount of arable land • Why would we use agricultural density rather than physiological density?
What are the pros and cons of each type of density measurement? • Choose three countries and quickly analyze their population density data: Look at all the information you have and tell me what we can learn.
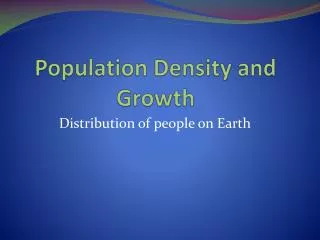
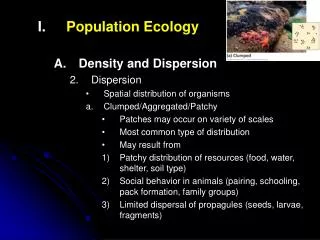
Population Where are the people?
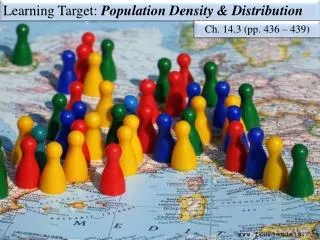
Demography • The scientific study of population characteristics • Death rate • Birth rate • Infant Mortality rate • Age • Where are the people?
Ecumene • The portion of the Earth’s surface occupied by permanent human settlements • What would make a place uninhabitable?
World Population Changes • What causes a population to grow or shrink? • CBR: Crude Birth Rate • The total number of live births in a year for every 1000 people in a society • CDR: Crude Death Rate • The total number of deaths in a year for every 1,000 people alive in the society • NIR: Natural Increase Rate • The percentage by which a population grows in a year. • CBR-CDR=NIR (converted into a percent) • Natural – excludes migration *Crude = society as a whole rather than looking at individual regions or population groups
Fertility • TFR: Total Fertility Rate • The average number of children a woman will have through her childbearing years • Another way of measuring the number of births (besides CBR) • TFR in some ways predicts the future, unlike CBR which just gives us data from the year
Mortality • IMR: Infant Mortality Rate • The annual number of deaths of infants under 1 year of age, compared with total live births • Life expectancy at birth • The average number of years a newborn infant can expect to live at current mortality levels
For example… • Population: 2,000 • Deaths:85 • What is the CDR? • Population: 39,128,000 • Births: 10,000 • What is the CBR?