Download
1 / 26
270 likes | 485 Views
Safe Routes. History of Safe Routes to School. Many child pedestrian fatalities in Denmark, 1970s Odense pilot program reduced the number of injured school children by 30% to 40% Caught on in UK and Canada in the 1990’s; Bronx, NY in 1997. Why Safe Routes?. Physical activity.

E N D
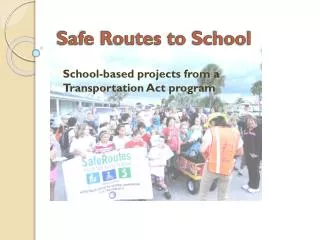
History of Safe Routes to School • Many child pedestrian fatalities in Denmark, 1970s • Odense pilot program reduced the number of injured school children by 30% to 40% • Caught on in UK and Canada in the 1990’s; Bronx, NY in 1997
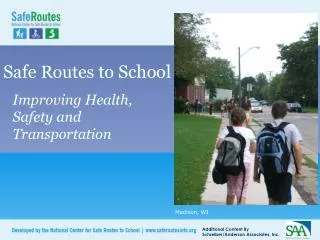
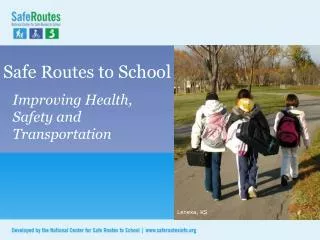
Physical activity Most kids aren’t getting the physical activity they need
Overweight children have an increased risk of… • Type 2 Diabetes • Low self esteem • Aggravating existing asthma • Sleep apnea • Decreased physical functioning • Many other negative emotional & physical effects
Physical activity recommendation for children: At least 60 minutes of physical activity on most, preferably all, days of the week. (US Depts. of Health and Human Services and Agriculture, 2005)
Promoting safe walking and bicycling is an ideal strategy to increase physical activity.
Fewer kids are biking and walking. More parents are driving. 2001: • 16% walked 1969: • 42% walked (CDC, 2005)
Individual barriers to walking and bicycling to school • Long distances 62% • Traffic danger 30% • Adverse weather 19% • Fear of crime danger 12% (CDC, 2005)
It’s not just distance Students who live within 1 mile and walk or bike: 2001: 63% 1969: 87% (CDC, 2005)
ROAD and TRAFFIC- Traffic danger When speeds are lowered from 40 to 20 mph injuries are decreased from 85% 5% deaths.
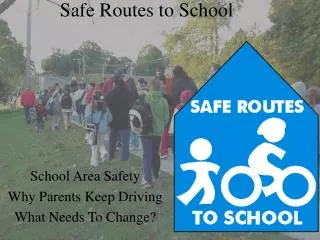
ROAD and TRAFFIC- Conditions make it hard to walk or bike
Fear of crime danger • Both perceptions and realities • Some low probability events provoke the greatest fears • Communities are finding ways to safeguard against these fears
Difficult community issues • Traffic flow problems • Abandoned buildings • Illegal behaviors
Creating a Safe Routes Program • Involve the entire community • Utilize existing people and groups with interest • Collect data-Map your community • Analyze problems • Identify projects and Develop a plan • Evaluate, make needed changes and keep moving forward
Elements of a Safe Routes • Education • Enforcement • Encouragement • Engineering • Evaluation
Education Teaching safety skills Creating safety awareness Fostering life-long safety habits Includes parents, neighbors and other drivers
Enforcement Increasing awareness of pedestrians and bicyclists Improving driver behavior Helpings children follow traffic rules Decreasing parent perceptions of danger
Encouragement Increasing popularity of walking and biking Is an easy way to start SRTS programs Emphasizes fun of walking and biking
Engineering Traffic calming and speed reduction improvements Pedestrian and bicycle crossing improvements On-street bicycle facilities Off-street bicycle and pedestrian facilities, Secure bicycle parking facilities
Desired outcomes of the Safe Routes to School Program include: • More children walking and bicycling to and from schools • Decreased traffic congestion • Improved childhood health –decrease obesity • Encouragement of healthy and active lifestyles • Improved community safety – bike, walking and traffic • Reduced fuel consumption and improve air quality • Enhanced community accessibility • Improvements to the physical environment that increase the ability to walk and bicycle to and from schools • Increased interest in bicycle and pedestrian accommodations throughout a community • Improved partnerships among schools, local municipalities, parents, and other community groups, including non-profit organizations
What would help neighborhood watch • Speed limits • More pedestrian traffic • ___ • ___
Contact Information • Connie Abert Waupaca County UW-Extension • 715-258-6226 • 811 Harding ST., Waupaca • connie.abert@ces.uwex.edu