Download

1 / 16
160 likes | 311 Views
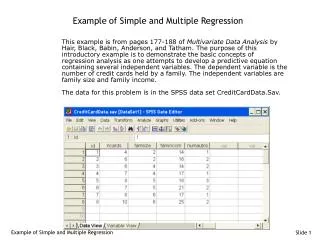
Regression Example. Using Pop Quiz Data. Second Pop Quiz. At my former school (Irvine), I gave a “pop quiz” to my econometrics students. The quiz consisted of 10 questions. The first five questions were trivia-type questions. The second five questions tested TV knowledge.

E N D
Regression Example Using Pop Quiz Data
Second Pop Quiz • At my former school (Irvine), I gave a “pop quiz” to my econometrics students. • The quiz consisted of 10 questions. • The first five questions were trivia-type questions. • The second five questions tested TV knowledge. • The last question asked students to report GPAs.
First Five Questions • Who is the Secretary of Defense? • Who is the Speaker of the House? • What is the capital of Brazil?
Second Five Questions • On “The Simpsons” Who Owns the Quickie Mart? • On “Malcom in the Middle” what is the name of Malcom’s older brother? • Who recently (not so recent any more) left “The West Wing”? • On “ER” who is the doctor from Croatia? • On “Everybody Loves Raymond” what does Raymond do for a living?
My Favorite Answers • Who is the Speaker of the House: • George Bush • Who is the Croatian from ER: • Toni Kukoc • What is your GPA? • You don’t even want to know.
My Favorite Answers (Cont’d) • What is the capital of Brazil? • Irvine • Who is Malcom’s older Brother? • Justin • Who recently left the West Wing? • Michael J. Fox.
Regression Example • Compute Number Correct for Each Set of 5. • Match Number Correct with Midterm Score • Only Include Those Quizzes with some answers. • See if Number Correct is Correlated with Midterm Performance. • First Five (+), Second Five (-)?
Source | SS df MS Number of obs = 57-------------+------------------------------ F( 2, 54) = 2.88 Model | 25.7073896 2 12.8536948 Prob > F = 0.0650 Residual | 241.345242 54 4.46935633 R-squared = 0.0963-------------+------------------------------ Adj R-squared = 0.0628 Total | 267.052632 56 4.76879699 Root MSE = 2.1141------------------------------------------------------------------------------ midterm | Coef. Std. Err. t P>|t| [95% Conf. Interval]-------------+---------------------------------------------------------------- right_1 | .8168767 .3513228 2.33 0.024 .1125169 1.521236 right_2 | .1041826 .2916515 0.36 0.722 -.4805435 .6889088 _cons | 20.11405 .6115866 32.89 0.000 18.88789 21.3402 • The Number correct on the first 5 questions is a significant predictor of the midterm score. • (Every additional question answered correctly is associated with a .82 point increase in the midterm score.) • This coefficient is statistically significant at the 5 percent level, but not the one percent level.
Source | SS df MS Number of obs = 57-------------+------------------------------ F( 2, 54) = 2.88 Model | 25.7073896 2 12.8536948 Prob > F = 0.0650 Residual | 241.345242 54 4.46935633 R-squared = 0.0963-------------+------------------------------ Adj R-squared = 0.0628 Total | 267.052632 56 4.76879699 Root MSE = 2.1141------------------------------------------------------------------------------ midterm | Coef. Std. Err. t P>|t| [95% Conf. Interval]-------------+---------------------------------------------------------------- right_1 | .8168767 .3513228 2.33 0.024 .1125169 1.521236 right_2 | .1041826 .2916515 0.36 0.722 -.4805435 .6889088 _cons | 20.11405 .6115866 32.89 0.000 18.88789 21.3402 • The Number correct on the second 5 (TV questions) is not a significant predictor of midterm score. • It seems to have no predictive power, and its t-statistic is very low.
Source | SS df MS Number of obs = 57-------------+------------------------------ F( 2, 54) = 2.88 Model | 25.7073896 2 12.8536948 Prob > F = 0.0650 Residual | 241.345242 54 4.46935633 R-squared = 0.0963-------------+------------------------------ Adj R-squared = 0.0628 Total | 267.052632 56 4.76879699 Root MSE = 2.1141------------------------------------------------------------------------------ midterm | Coef. Std. Err. t P>|t| [95% Conf. Interval]-------------+---------------------------------------------------------------- right_1 | .8168767 .3513228 2.33 0.024 .1125169 1.521236 right_2 | .1041826 .2916515 0.36 0.722 -.4805435 .6889088 _cons | 20.11405 .6115866 32.89 0.000 18.88789 21.3402 • Less than 10 percent of the variation in midterm scores is explained by variation in the number of questions answered correctly. • Prediction: What is the expected midterm score for someone getting 0 questions correct: • Ans: Just the Intercept: 20.11 • Prediction: Expected Score for Getting 2 correct on each section: • Ans: 20.11 + .8168(2) + .1042(2) = 21.95.
Source | SS df MS Number of obs = 57-------------+------------------------------ F( 2, 54) = 2.88 Model | 25.7073896 2 12.8536948 Prob > F = 0.0650 Residual | 241.345242 54 4.46935633 R-squared = 0.0963-------------+------------------------------ Adj R-squared = 0.0628 Total | 267.052632 56 4.76879699 Root MSE = 2.1141------------------------------------------------------------------------------ midterm | Coef. Std. Err. t P>|t| [95% Conf. Interval]-------------+---------------------------------------------------------------- right_1 | .8168767 .3513228 2.33 0.024 .1125169 1.521236 right_2 | .1041826 .2916515 XXXX 0.722 -.4805435 .6889088 _cons | 20.11405 .6115866 32.89 0.000 18.88789 21.3402 • Fill In Missing T-Statistic. • The missing value is the t-statistic under the Null that the Coefficient on right_2 = 0. • So, the t-statistic is (.1042-0)/.2917 = .357
Source | SS df MS Number of obs = 57-------------+------------------------------ F( 2, 54) = 2.88 Model | 25.7073896 2 12.8536948 Prob > F = 0.0650 Residual | 241.345242 54 4.46935633 R-squared = 0.0963-------------+------------------------------ Adj R-squared = 0.0628 Total | xxxxxxxxxx 56 4.76879699 Root MSE = 2.1141------------------------------------------------------------------------------ midterm | Coef. Std. Err. t P>|t| [95% Conf. Interval]-------------+---------------------------------------------------------------- right_1 | .8168767 .3513228 2.33 0.024 .1125169 1.521236 right_2 | .1041826 .2916515 0.36 0.722 -.4805435 .6889088 _cons | 20.11405 .6115866 32.89 0.000 18.88789 21.3402 • Fill In Missing TSS. • Since TSS = ESS + RSS, • TSS = 25.707 + 241.345 = 267.052
Source | SS df MS Number of obs = 57-------------+------------------------------ F( 2, 54) = 2.88 Model | 25.7073896 2 12.8536948 Prob > F = 0.0650 Residual | 241.345242 54 4.46935633 R-squared = xxxxxx-------------+------------------------------ Adj R-squared = 0.0628 Total | 267.052632 56 4.76879699 Root MSE = 2.1141------------------------------------------------------------------------------ midterm | Coef. Std. Err. t P>|t| [95% Conf. Interval]-------------+---------------------------------------------------------------- right_1 | .8168767 .3513228 2.33 0.024 .1125169 1.521236 right_2 | .1041826 .2916515 0.36 0.722 -.4805435 .6889088 _cons | 20.11405 .6115866 32.89 0.000 18.88789 21.3402 • Fill In Missing R-squared value: • R-squared is defined as the Model Sum of Squares (ESS) divided by TSS. • So, R-squared is 25.707/267.052 = .0963
Source | SS df MS Number of obs = 57-------------+------------------------------ F( 2, 54) = 2.88 Model | 25.7073896 2 12.8536948 Prob > F = 0.0650 Residual | 241.345242 54 4.46935633 R-squared = 0.0963-------------+------------------------------ Adj R-squared = 0.0628 Total | 267.052632 56 4.76879699 Root MSE = 2.1141------------------------------------------------------------------------------ midterm | Coef. Std. Err. t P>|t| [95% Conf. Interval]-------------+---------------------------------------------------------------- right_1 | .8168767 .3513228 2.33 0.024 xxxxxxxx xxxxxxxx right_2 | .1041826 .2916515 0.36 0.722 -.4805435 .6889088 _cons | 20.11405 .6115866 32.89 0.000 18.88789 21.3402 • Fill In Missing Confidence Interval: • The 5 percent critical value from t57-3 or t54is (approximately) 2.00 • So, the lower part of the interval is • .8169 – 2.00(.3513) = .1141 • And the upper part of the interval is • .8169 + 2.00(.3513) = 1.519.
Source | SS df MS Number of obs = 57-------------+------------------------------ F( 2, 54) = 2.88 Model | 25.7073896 2 12.8536948 Prob > F = 0.0650 Residual | 241.345242 54 4.46935633 R-squared = 0.0963-------------+------------------------------ Adj R-squared = 0.0628 Total | 267.052632 56 4.76879699 Root MSE = 2.1141------------------------------------------------------------------------------ midterm | Coef. Std. Err. t P>|t| [95% Conf. Interval]-------------+---------------------------------------------------------------- right_1 | .8168767 .3513228 2.33 0.024 .1125169 1.521236 right_2 | .1041826 .2916515 0.06 0.722 -.4805435 .6889088 _cons | 20.11405 .6115866 32.89 0.000 18.88789 21.3402 • Given the results on the table, how could you estimate the variance parameter,s2 ? • Sounds like an interesting test question ...