Download
1 / 7
70 likes | 169 Views
Summary of User Feedback on GOES-R Air Quality Proving Ground Summer 2011 Experiment. Shobha Kondragunta , Amy Huff, and Raymond Hoff Proving Ground All-Hands Meeting September 12, 2011. Overview of GOES-R AQPG Summer Experiment. Objectives:

E N D
Summary of User Feedback on GOES-R Air Quality Proving Ground Summer 2011 Experiment ShobhaKondragunta, Amy Huff, and Raymond Hoff Proving Ground All-Hands Meeting September 12, 2011
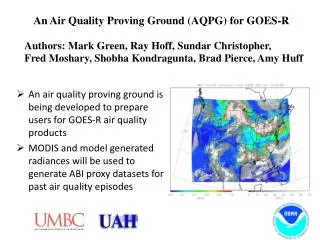
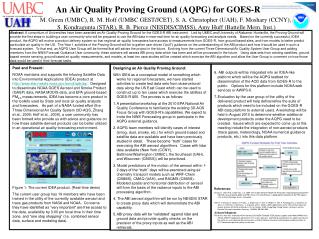
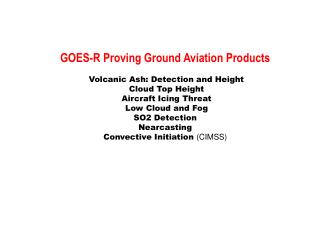
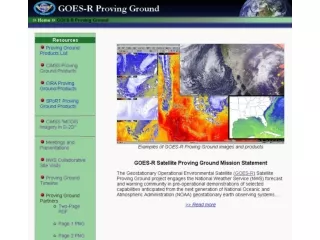
Overview of GOES-R AQPG Summer Experiment • Objectives: • Test the generation of GOES-R ABI aerosol products using simulated radiances • Distribute the products to users in near real time • Obtain feedback from users on the usability of the products • Proxy aerosol products: • AOD, aerosol type, RGB • Domain: Southeastern U.S. • Streaming hourly images, 12:00 – 23:00 UTC daily, July 12-30, 2011 • Experiment is being conducted during the NASA DISCOVER-AQ field campaign • Availability of aerosol vertical profiles and other physical/chemical properties for ABI validation
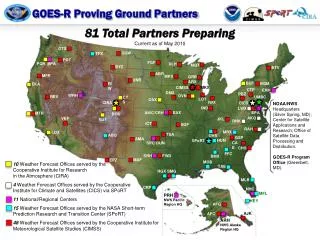
Feedback from User Community • Selected members of AQPG Advisory Group providing feedback on streaming NRT proxy images: • Bill Ryan, forecaster for Philadelphia, PA • Howard Schmidt, analyst/modeler for EPA Region 3 • Dan Salkovitz, forecaster for state of Virginia • Mike Goldstein, forecaster for Memphis/Shelby Counties, TN • Geoffrey Healan, forecaster for state of Alabama • Focusing on process of receiving streaming images of dynamic, high accuracy, high temporal resolution (once per hour) aerosol imagery • Different from current satellite products (e.g., 2 static MODIS AOD images per day or lower spatial resolution GASP loops)
Feedback on AOD Product Clarify in “product description” that white areas are clouds and grey areas are missing retrievals, Use EPA Air Quality Index (AQI) colors, Create 3-6 hr. composite and add few critical contours corresponding to AQI, Provide forward trajectories, Provide ability to zoom into city-level for in-depth analysis, Overlay satellite-derived wind speeds at different heights over AOD image
Feedback on Aerosol Type Product • Explain generic aerosol, • Aerosol type color scale is difficult to interpret, • Consistent shift in aerosol type from dust to generic to urban to smoke around 20:00 to 2100 UTC from day to day
Feedback on Synthetic Natural Color Product • Images became blurry and brighter after approximately 1800 – 2100 UTC, • Clarify in “product description” that white areas are clouds and grey areas are smoke and haze
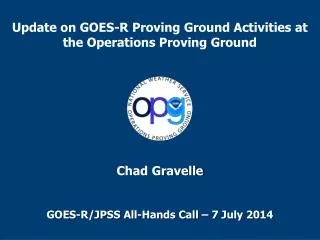
CIRA vs STAR Synthetic (Simulated Green Band) RGB Synthetic RGB from CIRA Algorithm Synthetic RGB from STAR Algorithm Gaps (red color) in CIRA version of the synthetic RGB. LUTs are not fully populated (only 4%). Also, no viewing geometry dependency for reflectances in the LUTs and Rayleigh correction applied after the LUT search. Results were shared with Don Hillger (NOAA at CIRA).