Download
1 / 12
120 likes | 292 Views
Fish Testing Flow Tank Team. Team Members Matt Malynowski Todd Nylund Tim Wiese Brian Eggelston Capstone Advisor Dr. Lemmy Meekisho Sponsor Randy Zelick . Customer: Dr. Randy Zelick. PSU Biology Dept .

E N D
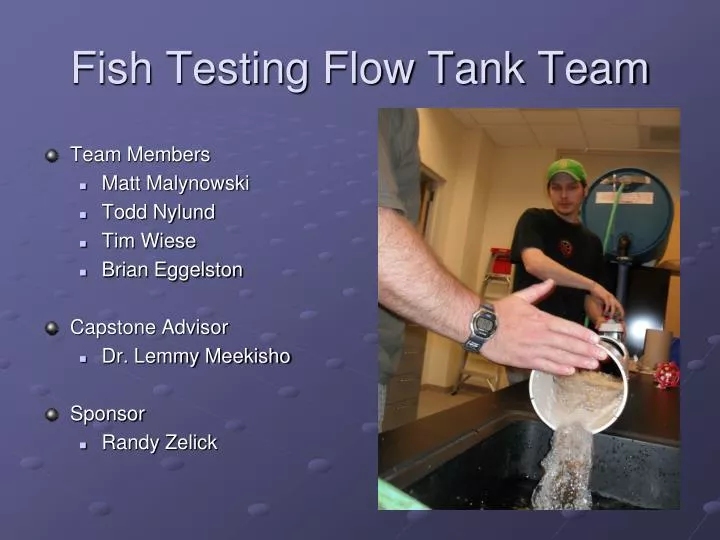
Fish Testing Flow Tank Team • Team Members • Matt Malynowski • Todd Nylund • Tim Wiese • Brian Eggelston • Capstone Advisor • Dr. Lemmy Meekisho • Sponsor • Randy Zelick
Customer: Dr. Randy Zelick PSU Biology Dept. Dr. Zelick, has asked us to design a flow tank for testing fish reactions to changes in direction and velocity in simulated stream flow.
CONTINUITYSystem response → The WEIR*Maintaining Constant Channel Volume and the Loss Channel velocity adjustment & static datum • Initially the WEIR retains water for pre-test treatment • Incremented scale measures WEIR location and experimental data provides empirical relationship with flow velocity Gate Valve provides pressure differential and adjustability • Slight volume decrease occurs when WEIR descends. Control of gate satisfies volumetric flow needed to maintain channel volumetric datum
RECIRCULATION OF TEST H2O • Operating Pt.→Q=50gpm • Tank Head → 8ft • 1½ inch Plastic Pipe (22.8-ft) - Schedule 80 • Six 90° Fittings @Vavg = 2.25-ft/s • Neglect Pump Loss • Total Loss
PUMP vs. SPECIFICATION • Total Piping Loss = 15.5 ft Head Loss
Scale of Resolution Flow meter or bucket & clock CONSERVATION of Mass Qin = Qout Where Q = Ai * Vi Reynolds Number Re < 2300 for Laminar Flow
Validating The Design Empirical Process • The Iterative ProcessExperiments using a removable semi-circular wooden weir with 2” rectangular cut from center initially started empirical process. Clear plastic inserts enabled variable speed experimentation with steady channel volume to occur. Results considered with admiral promise as adjustable-weir design targets in on specifications.
EXPERIMENTAL FLOW Experimental velocities ranged from approximately ~3cm/s to ~20cm/s. The flow has nice continuous motion with no strong eddy currents disrupting the dye streamers Good velocity profile showing nice orientation and the minimal frictional effects of circular geometries.
Special Thanks • The F23T team would like to thank: • Dr. Lemmy Meekisho for his support throughout the last 2 terms. • Dr. Randy Zelick for the opportunity to allow us to design this flow channel