Download
1 / 39
390 likes | 465 Views
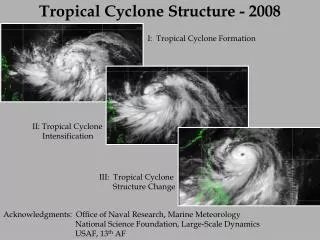
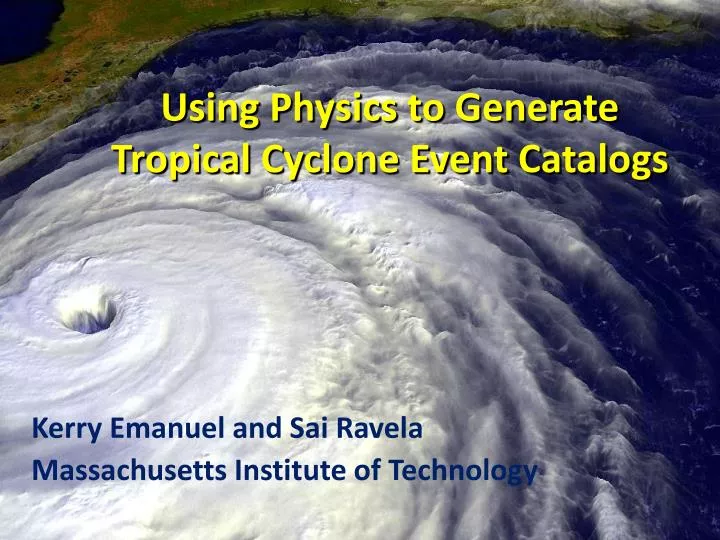
Using Physics to Generate Tropical Cyclone Event Catalogs. Kerry Emanuel and Sai Ravela Massachusetts Institute of Technology. Risk Assessment Methods. Methods based on hurricane history Numerical Simulations Downscaling Approaches. Issues with Historically Based Risk Assessment.

E N D
Using Physics to Generate Tropical Cyclone Event Catalogs Kerry Emanuel and Sai Ravela Massachusetts Institute of Technology
Risk Assessment Methods • Methods based on hurricane history • Numerical Simulations • Downscaling Approaches
Issues with Historically Based Risk Assessment • Historical record too short to provide robust assessment of intense (damaging) events • Numerous quality problems with historical records • History may be a poor guide to the future, owing to natural and anthropogenic climate change
Using Global and Regional Models to Simulate HurricanesThe Problem: • Global models are far too coarse to simulate high intensity tropical cyclones • Embedding regional models within global models introduces problems stemming from incompatibility of models, and even regional models are usually too coarse • Models to expensive to run many times.
Histograms of Tropical Cyclone Intensity as Simulated by a Global Model with 50 km grid point spacing. (Courtesy Isaac Held, GFDL) Category 3
Our Solution: Drive a simple but very high resolution, coupled ocean-atmosphere TC model using boundary conditions supplied by aglobal model or reanalysis data set
CHIPS: A Time-dependent, axisymmetric coupled model phrased in R space • Hydrostatic and gradient balance above PBL • Moist adiabatic lapse rates on M surfaces above PBL • Boundary layer quasi-equilibrium • Deformation-based radial diffusion
Application to Assessing Tropical Cyclone Risk in a Changing Climate
Approach: Step 1: Seed each ocean basin with a very large number of weak, randomly located cyclones Step 2: Cyclones are assumed to move with the large scale atmospheric flow in which they are embedded, plus a correction for earth rotation and curvature Step 3: Run the CHIPS model for each cyclone, and note how many achieve at least tropical storm strength Step 4: Using the small fraction of surviving events, determine storm statistics. Details: Emanuel et al., Bull. Amer. Meteor. Soc., 2008
200 Synthetic U.S. Landfalling tracks (color coded by Saffir-Simpson Scale)
Calibration Absolute genesis frequency calibrated to North Atlantic during the period 1980-2005
Genesis rates Western North Pacific Southern Hemisphere Eastern North Pacific North Indian Ocean Atlantic Calibrated to Atlantic
Cumulative Distribution of Storm Lifetime Peak Wind Speed, with Sample of 1755Synthetic Tracks 95% confidence bounds
Couple to Storm Surge Model (SLOSH) Courtesy of Ning Lin, Princeton University
Histogram of the SLOSH-model simulated (primary) storm surge at the Battery for 7555 synthetic tracks that pass within 200 km of the Battery site.
Now Use Daily Output from IPCC Models to Derive Wind Statistics, Thermodynamic State Needed by Synthetic Track Technique
Compare two simulations each from 7 IPCC models: 1.Last 20 years of 20th century simulations2. Years 2180-2200 of IPCC Scenario A1b (CO2 stabilized at 720 ppm)
Basin-Wide Percentage Change in Power Dissipation Different Climate Models
Economic Analysis of Impact of Climate Change on Tropical Cyclone Damages With Robert Mendelsohn Yale
Change in Total Annual Damage in U.S. $millions,2000-2100, under Scenario A1b
Summary: • History to short and inaccurate to deduce real risk from tropical cyclones • Global (and most regional) models are far too coarse to simulate reasonably intense tropical cyclones • Globally and regionally simulated tropical cyclones are not coupled to the ocean
We have developed a technique for downscaling global models or reanalysis data sets, using a very high resolution, coupled TC model phrased in angular momentum coordinates Model shows high skill in capturing spatial and seasonal variability of TCs, has an excellent intensity spectrum, and captures well known climate phenomena such as ENSO and the effects of warming over the past few decades Summary (2)
Summary (3) • Application to global models under warming scenarios shows great regional and model-to-model variability. As with many other climate variables, global models are not yet capable of simulating regional variability of TC metrics • Predicted climate impacts from all extreme events (including tropical storms) range from $17 to $25 billion/yr global damages by 2100
Total Number of Landfall Events, by Category, 1870-2004 Source: Pielke and Landsea
U.S. Hurricane Damage, 1900-2004, Adjusted for Inflation, Wealth, and Population
Some U.S. Hurricane Damage Statistics: • >50% of all normalized damage caused by top 8 events, all category 3, 4 and 5 • >90% of all damage caused by storms of category 3 and greater • Category 3,4 and 5 events are only 13% of total landfalling events; only 30 since 1870 • Landfalling storm statistics are grossly inadequate for assessing hurricane risk
6-hour zonal displacements in region bounded by 10o and 30o N latitude, and 80o and 30o W longitude, using only post-1970 hurricane data
3000 Tracks within 100 km of Miami 95% confidence bounds
Captures effects of regional climate phenomena (e.g. ENSO, AMM)
Year by Year Comparison with Best Track and with Knutson et al., 2007