Download
1 / 48
510 likes | 833 Views
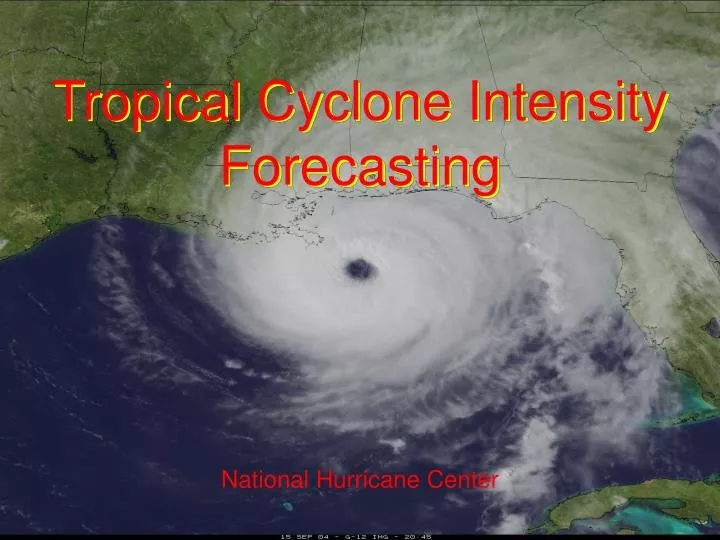
Tropical Cyclone Intensity Forecasting. National Hurricane Center. OUTLINE: TC INTENSITY FORECASTING. INTENSITY DEFINITION HOW TO ESTIMATE CURRENT INTENSITY FACTORS THAT INFLUENCE INTENSITY CHANGE NUMERICAL GUIDANCE FOR INTENSITY FORECASTING OFFICIAL INTENSITY FORECASTS.

E N D
Tropical Cyclone Intensity Forecasting National Hurricane Center
OUTLINE: TC INTENSITY FORECASTING • INTENSITY DEFINITION • HOW TO ESTIMATE CURRENT INTENSITY • FACTORS THAT INFLUENCE INTENSITY CHANGE • NUMERICAL GUIDANCE FOR INTENSITY FORECASTING • OFFICIAL INTENSITY FORECASTS
WHAT IS THE INTENSITY OF A TROPICAL CYCLONE? • Maximum sustained surface wind: Maximum wind, averaged over a 1 minute interval at an altitude of 33 ft (10 m), associated with the circulation of the tropical cyclone at a given point in time. • With very, very few exceptions, direct observations of the maximum sustained surface wind in a tropical cyclone are not available.
HOW DO WE ESTIMATE INTENSITY? • Aircraft reconnaissance • flight-level winds • GPS dropsondes • Stepped Frequency Microwave Radiometer (SFMR) • Airborne doppler radar • Satellites • Geostationary IR and VIS (Dvorak technique) • AMSU • QuikSCAT • Surface observations • ships, buoys, land stations (limited)
SURFACE OBSERVATIONS CAN OCCASIONALLY BE USED TO ESTIMATE INTENSITY
Dvorak Technique GOES-12 IR 1745 UTC 5 Sep 2003 Tropical cyclones have characteristic cloud patterns that correspond to stages of development and certain intensities.
Hurricane Floyd 1999 Warm Core Observations from NOAA Polar Orbiting Satellites AMSU Intensity Estimates
AMSU Central Pressure Estimates vs Recon for Hurricane Isidore (2002)
50 kt QuikSCATTropical Storm Zeta (2005-06) QuikSCAT overpass 0840 UTC 1 Jan 2006 METEOSAT-8 IR image 0900 UTC
AIRCRAFTRECONNAISSANCE(WHEN THERE IS A THREAT TO LAND) AFRC/53WRS C-130 NOAA/AOC P-3 Hurricane Georges Eyewall Photo: M Black HRD
90 kt 95 kt 105 kt 90 kt RECON FLIGHT-LEVEL WINDS HURRICANE GEORGES 9/20/98 20-23Z RECON FLIGHT-LEVEL (10,000 FT) WINDS
GPS DROPWINDSONDE • Developed in conjunction with the NOAA Gulfstream-IV jet aircraft. First systematic use for intensity was in 1998’s Hurricane Bonnie. • GPS dropsondes provide direct measurements of the winds at low levels in the hurricane eyewall. • Dropsonde data reveal that the structure of the eyewall is very complex, and can vary tremendously from storm to storm.
Because the hurricane is “warm-core”, winds increase downward from flight-level (10000 ft). Friction decreases wind in the lowest 1500 ft of the eyewall.
ALTHOUGH THE NORMAL RATIO OF SURFACE TO FLIGHT WIND SPEED IS 90%, SOME HURRICANES HAVE TROUBLE BRINGING THEIR HIGH WINDS DOWN TO THE SURFACE.
THE SURFACE WINDS CAN EXCEED THE FLIGHT-LEVEL WIND AT TIMES.
NEW DROPSONDE WIND SPEED MEASUREMENT IN A HURRICANE (ISABEL IN THE ATLANTIC, 12 SEPTEMBER 2003): 203 KNOTS NEAR 4500 FEET. New dropsonde wind speed record in a hurricane (Isabel in the Atlantic): 203 kt.
ALTHOUGH CENTRAL PRESSURE IS APPROXIMATELY RELATED TO INTENSITY, THERE CAN BE BIG VARIATIONS…AS MUCH AS TWO SAFFIR/SIMPSON CATEGORIES FOR THE SAME CENTRAL PRESSURE!
FACTORS AFFECTING TROPICAL CYCLONE INTENSITY • Sea surface temperature / upper ocean heat content. • Environmental winds, esp. vertical wind shear. • Trough interactions. • Temperature and moisture patterns in the storm environment. • Internal effects (eyewall replacement cycles). • Interaction with land.
UPPER OCEANIC HEAT CONTENT SEA SURFACE TEMPERATURE
VERTICAL WIND SHEAR 45000 ft DEEP CONVECTION 30000 ft 20000 ft 10000 ft EXPOSED CENTER 5000 ft 1000 ft
IN ADDITION TO LARGE-SCALE INFLUENCES, TROPICAL CYCLONE INTENSITY CHANGE CAN BE CAUSED BY INNER-CORE PROCESSES, SUCH AS EYEWALL REPLACEMENT CYCLES.AFTER A PERIOD OF SIGNIFICANT INTENSIFICATION, AN INNER EYEWALL IS OFTEN REPLACED BY AN OUTER EYEWALL. FIRST WE SEE CONCENTRIC EYEWALLS, AND THEN THE INNER EYEWALL DISSIPATES LEAVING AN OUTER EYEWALL (LARGER DIAMETER). SOME WEAKENING USUALLY OCCURS DURING THIS REPLACEMENT PROCESS.IN SOME CASES, THE OUTER EYEWALL CONTRACTS AND THE HURRICANE RE-STRENGTHENS TO COMPLETE THE CYCLE. THIS CYCLE COULD REPEAT SEVERAL TIMES IN THE LIFETIME OF THE HURRICANE.
CONCENTRIC EYEWALL CYCLEHURRICANE FLOYD 13 / 0116Z 13 / 1122Z 13 / 1347Z 13 / 2240Z 14 / 0104Z 14 / 1110Z 14 / 2228Z
CONCENTRIC EYEWALL CYCLEHURRICANE FLOYD 13 / 0116Z 13 / 1122Z 13 / 1347Z 13 / 2240Z 14 / 0104Z 14 / 1110Z 14 / 2228Z
CENTRAL PRESSURE VS. TIME FOR HURRICANE ALLEN, 1980: LARGE FLUCTUATIONS LARGELY DUE TO EYEWALL REPLACEMENT CYCLES
DRY AIR IN THE MIDDLE LEVELS OF THE ATMOSPHERE PROBABLY CAUSED THE STORM TO WEAKEN 50% 10% 30%
INLAND WIND DECAY MODEL: EXPONENTIAL DECREASE OF INTENSITY WITH TIME
TROPICAL CYCLONE INTENSITY FORECAST MODELS • Statistical Models:SHIFOR (Statistical Hurricane Intensity FORecast). Based solely on historical information - climatology and persistence. (Analog to CLIPER.) • Statistical/Dynamical Models:SHIPS (Statistical Hurricane Intensity Prediction Scheme): Based on climatology, persistence, and statistical relationships to current and forecast environmental conditions. • Dynamical Models:GFDL, GFS, UKMET, NOGAPS. Based on the present and the future by solving the governing equations for the atmosphere (and ocean).
TROPICAL CYCLONE INTENSITY STATISTICAL FORECAST MODELS • SHIFOR (Statistical Hurricane Intensity FORecast): Based solely on climatology and persistence. • SHIPS (Statistical Hurricane Intensity Prediction Scheme): Based on climatology, persistence, and current/predicted environmental conditions. • DSHIPS (Decay SHIPS): same as SHIPS except when track forecast points are over land – when a decrease in intensity following an inland decay model is included. • DSHIPS modified to include information about oceanic heat content and inner core convection (using infrared satellite imagery).
THE SHIPS MODEL Statistical multiple regression model relating tropical cyclone intensity change to various climatological, persistence, and environmental predictors. • (+) SST POTENTIAL (VMAX-V): Difference between the maximum potential intensity (depends on SST) and the current intensity. • (-) VERTICAL (850-200 MB) WIND SHEAR: Current and forecast. • (+) PERSISTENCE: If it’s been strengthening, it will probably continue to strengthen, and vice versa. • (-) UPPER LEVEL (200 MB) TEMPERATURE: Warm upper-level temperatures inhibit convection • (+) THETA-E EXCESS: Related to buoyancy (CAPE); more buoyancy is conducive to strengthening • (+) 500-300 MB LAYER AVERAGE RELATIVE HUMIDITY: Dry air at mid-levels inhibits strengthening
THE SHIPS MODEL (cont.) Statistical multiple regression model relating tropical cyclone intensity change to various climatological, persistence, and environmental predictors. • (+) 850 MB ENVIRONMENTAL RELATIVE VORTICITY: Vorticity is averaged over a large area, about 10° radius. Intensification is favored when the storm is in an environment of cyclonic low-level vorticity. • (-) ZONAL STORM MOTION: Intensification is favored when TCs are moving west • (-) STEERING LEVEL PRESSURE: intensification is favored for storms that are moving more with the upper level flow. This predictor usually only comes into play when storms get sheared off and move with the flow at very low levels (in which case they are likely to weaken). • (+) 200 MB DIVERGENCE: Divergence aloft enhances outflow and promotes strengthening • (-) CLIMATOLOGY: Number of days from the climatological peak of the hurricane season
Satellite/Oceanic Predictors have been added to SHIPS • GOES cold IR pixel count 3. Oceanic heat content from • GOES IR Tb standard deviation satellite altimetry • (TPC/UM algorithm)
A STATISTICAL TECHNIQUE TO AID IN THE FORECAST OF RAPID INTENSIFICATION: The 7 predictors used to estimate the probability of Rapid Intensification (defined as an increase in maximum wind speed of at least 25 kt over 24 h):
TROPICAL CYCLONE INTENSITY DYNAMICAL FORECAST MODELS • GFDL, NCEP Global Model (GFS), UKMET (U.K. Met Office), NOGAPS (U.S. Navy), ECMWF (European) • These models are of limited use, because of… • sparse observations • inadequate resolution (need to go down to a few km grid spacing; the GFDL, our highest-resolution operational hurricane model, is currently about 18 km) • incomplete understanding and simulation of basic physics of intensity change • biases in upper-level wind forecasts.
GFDL INTENSITY FORECASTS FOR KATRINA DID SHOW STRENGTHENING TO A MAJOR HURRICANE OVER THE GULF
GFDL FORECAST FROM 10/17/05 18Z OBSERVED Early on 19 October, Wilma deepened at a rate of ~ 10 mb/hr! GFDL MODEL DID CAPTURE SOME OF WILMA’S RAPID DEEPENING
observed 65 55 40 30 observed: dissipated
NHC OFFICIAL INTENSITY FORECAST • Based on statistical guidance from SHIPS and SHIFOR, qualitative guidance from dynamical models. • Persistence is used quite a bit! • Obvious signs in the environment, i.e. cooler waters, increasing upper-level winds, are taken into account • Generally corresponds to what is normalfor a storm in any particular situation (e.g. the standard Dvorak development rate). • Tends to be conservative; extreme events are almost never forecast. • For forecasts 24 h and beyond, the average error is roughly 1 SSHS Category (15-20 knots).
CONCLUDING REMARKS (INTENSITY FORECASTING) • Intensity forecasting is not as advanced as track forecasting. There is less skill for intensity forecasting than there is for track forecasting. • Current guidance is provided mainly by statistical models. While some improvements are still being sought, statistical models by their nature have difficulties capturing the outliers. • The main hope for the future lies in improved dynamical models, coupled with enhanced observations and understanding of the hurricane’s inner core. This is a long-term project.