Download
1 / 37
370 likes | 505 Views
Time of Day in FSUTMS. presented to Time of Day Panel presented by Krishnan Viswanathan, Cambridge Systematics, Inc. Jason Lemp, Cambridge Systematics, Inc. Thomas Rossi, Cambridge Systematics, Inc. August 12, 2010. Scope. Two phase project

E N D
Time of Day in FSUTMS presented toTime of Day Panel presented byKrishnan Viswanathan, Cambridge Systematics, Inc. Jason Lemp, Cambridge Systematics, Inc. Thomas Rossi, Cambridge Systematics, Inc. August 12, 2010
Scope • Two phase project • Phase 1 – Develop and implement factors from NHTS and count data • Phase 2 – Econometric models for incorporating into FSUTMS • Three tasks in Phase 1 • Develop and implement constant Time of Day factors • Develop new CONFAC • 2009 NHTS data for TOD factors • Identify data elements for econometric approach • Develop empirical methods to calculate travel skims
Data Overview • 2009 NHTS Data Used • 15,884 Households • 30,992 Persons • 114,910 Person Trips • 1.3% of trips are via Transit • All analysis done using mid point of trip • Trips into 24 one-hour periods
Segmentations for TOD • Compare across sampling regions • Compare across urban areas by population • Compare across income categories
ANOVA Tests for Time of Day Variability • Hypothesis: There is no variability among different levels
Variability Testing within Income Level • Hypothesis: There is no variability between different regions within each income level
Time of Day into Transit Modeling • Transit mode choice and assignment • Depends on transit paths between origins and destinations • Data sets are dominated by auto travel • Both household survey and count data • Examine differences in peaking for auto and transit demand • Transit might have different peak percent compared to autos for same trip purpose and direction
Time of Day into Transit Modeling • Simplest way to address discrepancy • Time of day after mode choice • While simple not necessarily correct • Different transit paths for mode choice and transit assignment • Transit factors by time of day based on household data leading to limited data on transit trips • Transit rider survey data as a solution?
Time of Day into Transit Modeling • Potential biases using transit ridership survey data • Not necessarily a random sample w.r.t. time of day • Clustered by route and time of day • Where transit is critical, two important considerations should be used to guide the definition of the time periods • How does transit level of service vary during the day • How does demand vary during the day
Time of Day into Transit Modeling • Transit level service variation during the day • Schedule information • Fare information • Define peak time periods to coincide closely to those used by transit providers • Include separate overnight period when no service is provided • Use ridership data to determine whether peak transit demand occurs at times similar to peak auto demand and peak transit supply
Time of Day into Transit Modeling • A particular transit network must be associated with each period • Look at LOS and if they are sufficiently similar different periods can have the same transit network • However, this assumes symmetric transit operating plan with similar LOS at both peaks • If auto access is included in the model there is substantial asymmetry • Using same network and skims for AM and PM periods can produce inaccuracy in model results
Validating Time of Day Models • Two important considerations • Validating the time of day modeling component itself • Validation of other model components
Validating Time of Day Modeling Component • Reasonable checks • Model parameters • Application results • Compare factors by trip purpose to other areas • Compare to a wide range of areas • Consider unique characteristics of modeled area • Ideal to have independent data sources • Not always available • Checks may have to wait until other model components are complete
Validating Time of Day Modeling Component • Time of day choice models have different reasonableness checks • Few time of day models applied in the context of 4-step models • Compare model derived percentage of trips for each time period to survey data • Time of day choice models include sensitivity checks • Model components applied subsequent to TOD should be run for each time period • Implies consideration of TOD by each model component
Validating Highway Assignment • VMT, Volume, and Speed checks • With TOD consider link volumes and speed/travel times for each time period • Modeled daily volumes are critical to provide context to travel demand • First validate daily volumes then by time period • RMSE and Percent differences may track higher than daily differences • Always validate AM and PM peaks
Validating other Model Components • Validate transit assignment and mode choice models at daily and time period levels • Crucial for transit assessment • Perform transit assignment checks at daily level first and then validate ridership for peak periods • Validate trip distribution outputs by time of day • Not all data sources (especially secondary data sources) might allow for checks only at the daily level
Time of Day Choice Models • Purpose of Investigation • Estimate time-of-day (TOD) models to make recommendations for incorporating TOD in FSUTMS. • Key Elements: • Examine data to understand resolution of TOD modeling that can be achieved • Develop a modeling framework • Estimate TOD models to understand key determinants of TOD choice
Data • Three datasets: • National Household Travel Survey (NHTS) • NE & SE Florida Household Surveys • NHTS Data used here: • Provides many more observations (115,000 trip records vs. 22,000 and 20,000 records of other two datasets) • Relevant for the entire state of Florida (rather than particular regions of the state)
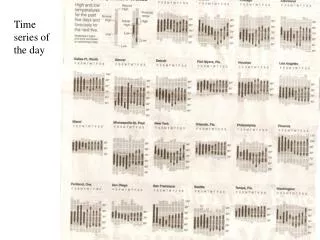
NHTS TOD Distributions Midpoint of Trip Start & End Times Reported Trip Start Times
Modeling Framework • Multinomial Logit (MNL) Structure • TOD units • Five broad TODs (AM, midday, PM, evening, & night) • 30-minute interval alternatives (except for evening & night periods) • Explanatory variables • A variety of household-, person-, & trip-specific variables introduced. • Specific to broad TOD periods • Interactions with shift variables
Findings from Model Estimation • Three trip purposes examined: • Home-based work (HBW) • Home-based other (HBO) • Non-home-based (NHB) • Model refinement not pursued here, since focus was on understanding determinants of TOD • Because model parameter estimates difficult to interpret on their own, predictive distributions generated for population segments to illustrate results
HBW Findings: Home-to-Work • Shift variables interacted with job type. • Variables with limited practical significance: • HH Size • Vehicles • Presence of Children in HH • Income • Gender • Region’s Population
HBW Findings: Work-to-Home • Shift variables interacted with job type. • Variables with limited practical significance: • Income • Gender • Region’s Population
HBO Findings: Home-to-Other • Shift variables interacted with: • HH Size • Presence of Children in HH • HOV mode • Variables with limited practical significance: • Income • Gender • Region’s Population
NHB Findings • Shift variables interacted with: • HH Size • Presence of Children in HH • HOV mode • Variables with limited practical significance: • Vehicles • Income • Gender • Region’s Population
Summary • Overall, models offer reasonable behavior for each trip type. • Job type variables very important for HBW trips • Household composition (e.g., household size, vehicles, presence of children) less important for HBW, but quite important for HBO & NHB trips • Several variables found to have little or no effect across models • Gender & region population have almost no practical significance • Household income & vehicles have only small implications on TOD choice for only some trip purposes
Next Steps and Schedule • Finish task 3 • Finalize documentation • Goal is to finish by end of September