Download
1 / 9
90 likes | 379 Views
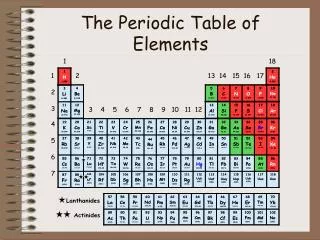
21.12 Look at the location of elements A, B, C, and D in the following periodic table:. Without looking at Figure 21.2, predict whether these elements are likely to be found in nature as carbonates, oxides, sulfides, or in uncombined form. Explain.

E N D
21.12 Look at the location of elements A, B, C, and D in the following periodic table: Without looking at Figure 21.2, predict whether these elements are likely to be found in nature as carbonates, oxides, sulfides, or in uncombined form. Explain.
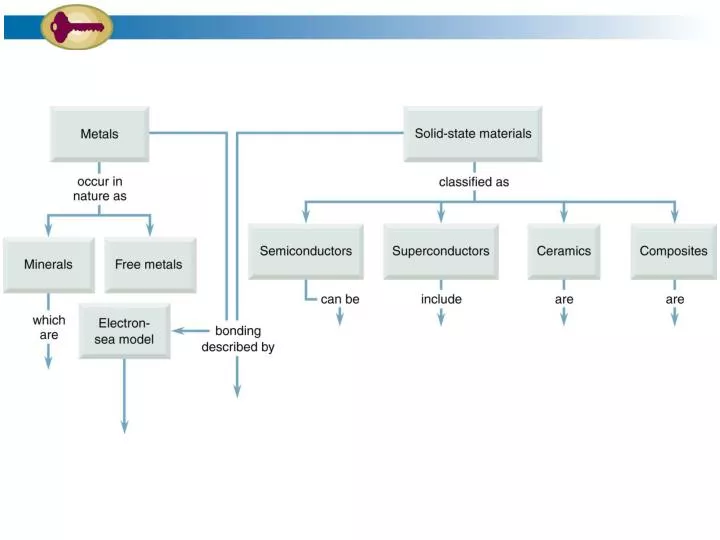
Among the methods for extracting metals from their ores are (i) roasting a metal sulfide, (ii) chemical reduction of a metal oxide, and (iii) electrolysis. The preferred method depends on the E° value for the reduction half-reaction Mn+ (ag) +ne M(s). 21.13 (a) Which method is appropriate for the metals with the most negative E° values? Which method is appropriate for the metals with the most positive E° values? Which method is appropriate for metals A, B, C, and D in the following periodic table? (b) (c)
21.14 The following pictures show the electron populations of the bands of MO energy levels for four different materials: (a) Classify each material as an insulator, a semiconductor, or a metal. Arrange the four materials in order of increasing electrical conductivity. Explain. Tell whether the conductivity of each material increases or decreases when the temperature increases. (b) (c)
21.15 The following pictures show the electron populations of the composite s–d bands for three different transition metals: (a) Which metal has the highest melting point? Explain. (b) Which metal has the lowest melting point? Explain. (c) Arrange the metals in order of increasing hardness. Explain.
21.16 The following picture represents the electron population of the bands of MO energy levels for elemental silicon: (a) Identify the valence band, conduction band, and band gap. In a drawing, show how the electron population changes when the silicon is doped with gallium. In a drawing, show how the electron population changes when the silicon is doped with arsenic. Compare the electrical conductivity of the doped silicon samples with that of pure silicon. Account for the differences. (b) (c) (d)
21.17 Sketch the electron populations of the bands of MO energy levels for elemental carbon (diamond), silicon, germanium, gray tin, and white tin. (Band gap data are given in Table 21.3.) Your sketches should show how the populations of the different bands vary with a change in the group 4A element.