Download
1 / 35
350 likes | 453 Views
Chemical and Dynamical Processes Affecting the Composition of the Tropical Pacific Troposphere. Amanda Staudt Ph.D. Thesis Defense May 2001. The oxidizing capacity of the atmosphere. The ability of the atmosphere to remove many pollutants

E N D
Chemicaland Dynamical Processes Affecting the Composition of the Tropical Pacific Troposphere Amanda Staudt Ph.D. Thesis Defense May 2001
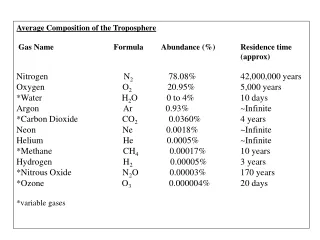
The oxidizing capacity of the atmosphere • The ability of the atmosphere to remove many pollutants • OH is the most important oxidant; formation of OH depends strongly on sunlight and water vapor: O3 + hv O2 + O(1D) O(1D) + H2O 2 OH Maximum OH is found in the tropics
How do biomass burning, fossil fuel combustion, and lightning perturb the chemical composition of the tropical Pacific troposphere?
Major findings 1. Large impact of biomass burning emissions on the chemical composition of the tropical Pacific troposphere 2. European and Asian fossil fuel emissions have a large and comparable impact on CO in the lower troposphere over the North Pacific 3. Pathway for interhemispheric exchange above the eastern Pacific 4. NOx over the tropical Pacific is not in chemical steady state
Pacific Exploratory Missions to the Tropics • Species measured: • O3 • NO and NO2 • CO, CO2, and CH4 • OH and HO2 • PAN and HNO3 • peroxides • CH2O • aerosols • many hydrocarbons
Biomass fire counts from the Along Track Scanning Radiometer (ATSR) PEM-Tropics A September 1996 PEM-Tropics B March-April 1999
PEM-Tropics BMarch-April 1999 PEM-Tropics A September 1996
Harvard 3-D Model of Emissions Chemistry and Transport • detailed O3-NOx-hydrocarbon chemistry • tracer advection • convective transport Ozone • wet and dry deposition Columns Harvard/FSU 3-D Model of Chemistry and Transport • 4° latitude x 5° longitude • 14 vertical layers • 1 hour timestep • 24 tracers ECMWF assimilated FSU Global Spectral Model meteorological • horizontal velocities analysis • pressure, temperature, and relative humidity • optical depth • convective activity outgoing longwave • precipitation radiation (OLR) and SSM/I rainrates
Outline • Biomass burning pollution from South America and Africa during PEM-Tropics A • Biomass burning and fossil fuel pollution from northern hemisphere continents during PEM-Tropics B • Pathways for interhemispheric exchange in the upper troposphere during PEM-Tropics B • Chemical cycling of NOx with HNO3 and PAN during PEM-Tropics A and B
Outline • Biomass burning pollution from South America and Africa during PEM-Tropics A • Biomass burning and fossil fuel pollution from northern hemisphere continents during PEM-Tropics B • Pathways for interhemispheric exchange in the upper troposphere during PEM-Tropics B • Chemical cycling of NOx with HNO3 and PAN during PEM-Tropics A and B
PEM-Tropics A observations from 0-30oS and 4-8 km Model Observations The strong correlation between O3 and CO demonstrates the pervasive influence of biomass burning over the South Pacific.
Outline • Biomass burning pollution from South America and Africa during PEM-Tropics A • Biomass burning and fossil fuel pollution from northern hemisphere continents during PEM-Tropics B • Pathways for interhemispheric exchange in the upper troposphere during PEM-Tropics B • Chemical cycling of NOx with HNO3 and PAN during PEM-Tropics A and B
PEM-Tropics B CO (ppb) Interhemispherictransport Biomass Burning River of pollution Interhemispherictransport Biomass Burning River of pollution Observed Simulated
Column CO (1017 molecules cm-2) North Americanfossil fuel 7% Europeanfossil fuel 12% Biomass burning 27% Asianfossil fuel 15%
Major findings • 1. Large impact of biomass burning emissions on the chemical composition of the tropical Pacific troposphere • During September 1996, biomass burning in South America and Africa contributed 27% of simulated CO over the South Pacific • Biomass burning in southeast Asia and India contributed 27% of simulated CO over the North Pacific during March-April, 1999
CO (ppb) at 400 m altitude North Americanfossil fuel 11% Europeanfossil fuel 19% Biomass burning 17% Asianfossil fuel 19%
Major findings • 1. Large impact of biomass burning emissions on the chemical composition of the tropical Pacific troposphere • During September 1996, biomass burning in South America and Africa contributed 27% of simulated CO over the South Pacific • Biomass burning in southeast Asia and India contributed 27% of simulated CO over the North Pacific during March-April, 1999 2. European and Asian fossil fuel emissions have a large and comparable impact on CO in the lower troposphere over the North Pacific
Outline • Biomass burning pollution from South America and Africa during PEM-Tropics A • Biomass burning and fossil fuel pollution from northern hemisphere continents during PEM-Tropics B • Pathways for interhemispheric exchange in the upper troposphere during PEM-Tropics B • Chemical cycling of NOx with HNO3 and PAN during PEM-Tropics A and B
Longitudinal gradients for 0-20oS and 8-12 km altitude Transport of CO in the upper troposphere (8-12 km altitude)
Convectiveoutflow Convectiveoutflow Westerly duct 25% 18% 32% Simulated transport fluxes of European fossil fuel CO during PEM-Tropics B 10-13.5 km altitude
Westerly duct = a region of upper tropospheric westerlies Zonal winds (m/s) in the upper troposphere during PEM-Tropics B Westerlies Westerly duct Easterlies Easterlies Westerlies • The westerly duct is strongest during: • northern hemisphere winter and spring • La Nina conditions
Major findings • 1. Large impact of biomass burning emissions on the chemical composition of the tropical Pacific troposphere • During September 1996, biomass burning in South America and Africa contributed 27% of simulated CO over the South Pacific • Biomass burning in southeast Asia and India contributed 27% of simulated CO over the North Pacific during March-April, 1999 2. European and Asian fossil fuel emissions have a large and comparable impact on CO in the lower troposphere over the North Pacific • 3. Pathway for interhemispheric exchange above the eastern Pacific • The westerly duct was the dominant conduit for northern hemispheric air into the southern hemisphere during March-April, 1999
Outline • Biomass burning pollution from South America and Africa during PEM-Tropics A • Biomass burning and fossil fuel pollution from northern hemisphere continents during PEM-Tropics B • Pathways for interhemispheric exchange in the upper troposphere during PEM-Tropics B • Chemical cycling of NOx with HNO3 and PAN during PEM-Tropics A and B
NOx budget PAN • NO +CH COO +M 2 3 2 • photolysis • thermal decomposition NO NO 2 • NO +OH+M 2 • N O +H O 2 5 2 Primary sources: HNO 3 • photolysis • lightning • HNO +OH • biomass burning 3 • fossil fuel • soils • deposition • biofuel burning • scavenging • aircraft Loss of NOx 1 @ Chemical steady state: Production of NOx
LNOx/PNOxduring PEM-Tropics A 6-12 km, 10-30oS Observed Average LNOx/PNOx=1.9-2.4 Harvard/FSU Model Average LNOx/PNOx=1.6
Sensitivity simulations: • Source of NOx from lightning increased by 50% • Convective scavenging of HNO3 by ice turned off • Acetone concentrations set to a minimum of 400 ppt • Acetaldehyde concentrations set to a minimum of 80 ppt
NOx chemical budget during PEM-Tropics B No scavengingby ice Standardsimulation Fixedacetaldehyde Fixedacetone
Major findings • 1. Large impact of biomass burning emissions on the chemical composition of the tropical Pacific troposphere • During September 1996, biomass burning in South America and Africa contributed 27% of simulated CO over the South Pacific • Biomass burning in southeast Asia and India contributed 27% of simulated CO over the North Pacific during March-April, 1999 2. European and Asian fossil fuel emissions have a large and comparable impact on CO in the lower troposphere over the North Pacific • 3. Pathway for interhemispheric exchange above the eastern Pacific • The westerly duct was the dominant conduit for northern hemispheric air into the southern hemisphere during March-April, 1999 • 4. NOx over the tropical Pacific is not in chemical steady state • Emissions of NOx from lightning maintain a chemical imbalance in the tropical upper troposphere • New observations of elevated carbonyl concentrations over the Pacific raise questions about PAN chemistry • Scavenging of HNO3 can also cause a chemical imbalance