Download
1 / 51
520 likes | 583 Views
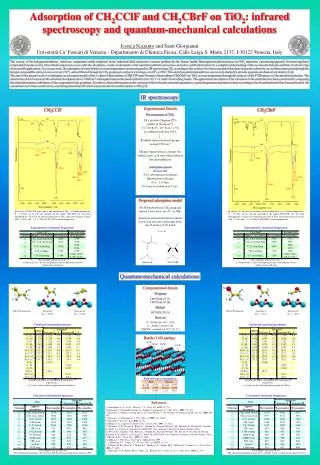
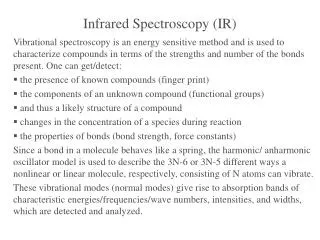
IR SPECTROSCOPY. Light is one form of electromagnetic radiation. Light is only a very small part of the electromagnetic spectrum. Electromagnetic waves consist of electric and magnetic fields which are perpendicular to each other and to the direction of travel of the wave.

E N D
Light is one form of electromagnetic radiation. • Light is only a very small part of the electromagnetic spectrum. • Electromagnetic waves consist of electric and magnetic fields which are perpendicular to each other and to the direction of travel of the wave. • The electric and magnetic fields vibrate at the same frequency as each other.
Atoms, molecules and ions can absorb (or emit) electromagnetic radiation of specific frequencies, and this can be used to identify them.
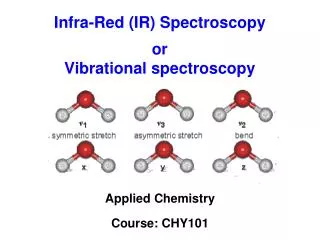
All bonds vibrate at a characteristic frequency. • There are different types of vibration. INFRA-RED SPECTROSCOPY Symmetric stretch Assymmetric stretch Bending • The frequency depends on the mass of the atoms in the bond, the bond strength, and the type of vibration. • The frequencies at which they vibrate are in the infra-red region of the electromagnetic spectrum.
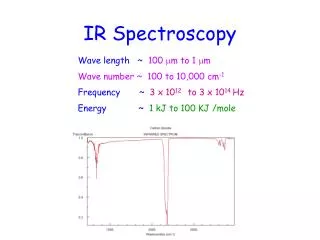
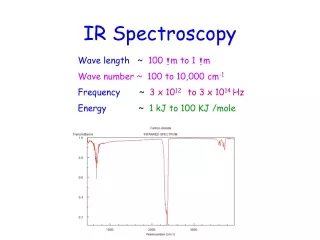
If IR light is passed through the compound, it will absorb some or all of the light at the frequencies at which its bonds vibrate. INFRA-RED SPECTROSCOPY • Wavenumbers (cm-1) are used as a measure of the wavelength or frequency of the absorption. Wavenumber = 1 wavelength (cm) • IR light absorbed is in the range 4000 – 400 cm-1. • Above 1500 cm-1 is used to identify functional groups. • Below 1500 cm-1 is used for fingerprinting.
Complicated and contains many signals – picking out functional group signals difficult. BELOW 1500 cm-1 – “Fingerprinting” • This part of the spectrum is unique for every compound, and so can be used as a "fingerprint". • This region can also be used to check if a compound is pure.
cyclohexane C–H
cyclohexene C–H
butanal C–H
ethanoic acid O–H
ethanol O–H
butanal C=O
propanone C=O
ethanoic acid C=O
methyl ethanoate C=O
Exercise 1 Match the following eight compounds to the following eight IR spectra. hex-2-ene pentane methylpropan-1-ol 2-methylpentan-3-one butanal butanoic acid propyl ethanoate nitrobenzene
propyl ethanoate C=O C-O
2-methylpentan-3-one C=O
methylpropan-1-ol O-H
nitrobenzene C-H
pentane C-H
butanal C-H C=O
butanoic acid O-H
hex-2-ene C-H C-H C=C