Download
1 / 74
1.08k likes | 1.69k Views
Infra-Red (IR) Spectroscopy. or Vibrational spectroscopy. Applied Chemistry. Course: CHY101. Electromagnetic Radiation. Frequency ( ). Wavelength ( ). UHF TV, cellular, telephones. (300 MHz and 3 GHz). Table lamp, Tube light (400 nm -800 nm or 400–790 THz). Sun Lamp. X-ray.

E N D
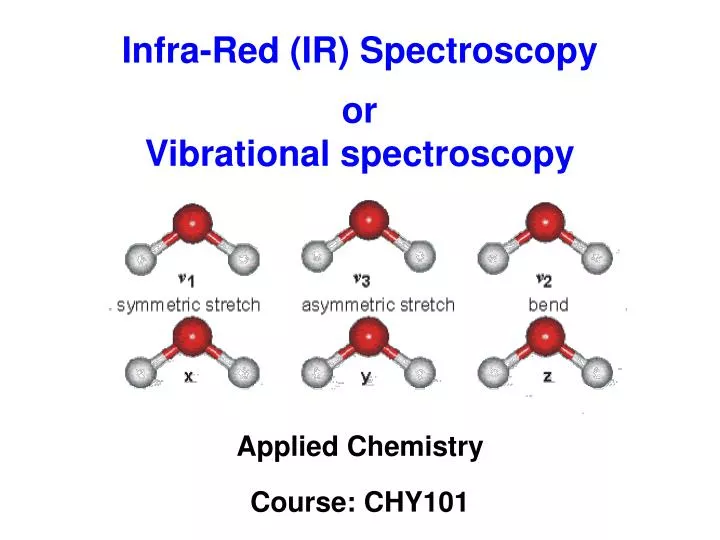
Infra-Red (IR) Spectroscopy or Vibrational spectroscopy Applied Chemistry Course: CHY101
Electromagnetic Radiation Frequency () Wavelength () UHF TV, cellular, telephones. (300 MHz and 3 GHz) Table lamp, Tube light (400 nm -800 nm or 400–790 THz) Sun Lamp X-ray FM Radio, VHF TV. AM Radio Microwave ovens, Police radar, satellite stations-- (3 to 30 GHz)
The interaction of radiation with matter http://hyperphysics.phy-astr.gsu.edu/hbase/mod3.html
Hook’s Law Hook’s Law, F = - k x F is the restoring force x is the displacement from equilibrium k is the force constant The restoring force proportional to the displacement of particlefrom its equilibrium position and the force constant k of the spring.
Vibrational spectra: Harmonic oscillator model The Simple Harmonic Oscillator Model: H2 molecule In this case, energy curve is parabolic, E = k (r – req)2 H2’ H1 H2” E2 E1 H2” H1 H2’ 1 2 req
Harmonic Oscillator Model The Simple Harmonic Oscillator Model: H2 molecule The compression & extension of a bond (like a spring) obeys Hooke’s Law, H2’ H1 H2” E2 f is the restoring force k is the force constant E1 H2” H1 H2’ 1 2 E = k (r – req)2 In this case, energy curve is parabolic, req
Anharmonic Oscillator Model Where a is a constant for a particular molecule and Deq is the dissociation energy. The Morse potential (blue) and harmonic oscillator potential (green). The potential at infinite internuclear distance is the dissociation energy for pure vibrational spectra.
Anharmonic oscillator model The actual potential energy of an anharmonic oscillator fits the parabolic function fairly well only near the equilibrium internuclear distance. The Morse potential function more closely resembles the potential energy of an anharmonic oscillator model. Where a is a constant for a particular molecule and Deq is the dissociation energy. Deq req Fig. The energy diagram of molecule’s vibrational model showing an (a) ideal diatomic or (b) anharmonic diatomic oscillator.
Vibrational spectra: Harmonic oscillator model Oscillation Frequency, k is the force constant = reduced mass, Vibrational frequency only dependent on the mass of the system and the force constant . From Schrodinger equation, Vibrational energies for simple harmonic oscillator,
Vibrational spectra: Harmonic oscillator model At Zero-point energy The implication is that the diatomic molecule (and, indeed, any molecule) can never have zero vibrational energy; the atoms can never be completely at rest relative to each other. The simple selection rule for the harmonic oscillator undergoing vibrational changes The allowed vibrational energy levels and transitions between them for a diatomic molecule undergoing simple harmonic motion.
Anharmonic oscillator model The Morse potential function more closely resembles the potential energy of an anharmonic oscillator model. Energy in a particular vibrational energy level of an anharmonic oscillator is found to be (from Schrodinger equation), Deq Where xe is the corresponding anharmonicity constant which, for bond stretching vibrations, is always small and positive (~ +0.01), so that the vibrational levels are crowd more closely together with increasing vibrational level v. req Fig. The energy diagram of molecule’s vibrational model showing an (a) ideal diatomic or (b) anharmonic diatomic oscillator.
Vibrational spectra: Anharmonic oscillator model Vibrational energies for simple harmonic oscillators, ……… A Vibrational energies for anharmonic oscillators, ……… B
Vibrational spectra: Harmonic oscillator model Oscillation Frequency, k is the force constant = reduced mass, • The vibrational frequency is increasing with: • increasing force constant k ( = increasing bond strength) • decreasing atomic mass • Example: k cc > kc=c > kc-c
Infrared Spectroscopy The vibrational frequency is increasing with: • increasing force constant k (= increasing bond strength) • decreasing atomic mass
Different types of Energy Connecting macroscopic thermodynamics to a molecular understanding requires that we understand how energy is distributed on a molecular level. ATOMS: The electrons: Electronic energy. Increase the energy of one (or more) electrons in the atom. Nuclear motion: Translational energy. The atom can move around (translate) in space. MOLECULES: The electrons: Electronic energy. Increase the energy of one (or more) electrons in the molecule. Nuclear motion: Translational energy. The entire molecule can translate in space. Vibrational energy. The nuclei can move relative to one another. Rotational energy. The entire molecule can rotate in space.
Molecular vibrations • How many vibrations are possible (= fundamental vibrations)? • A molecule has as many degrees of freedom as the total degree of freedom of its individual atoms. • Each atom has three degrees of freedom (corresponding to the Cartesian coordinates), thus in an N-atom molecule there will be 3N degree of freedom. • In molecules, movements of the atoms are constrained by interactions through chemical bonds.
Molecular vibrations Translation - the movement of the entire molecule while the positions of the atoms relative to each other remain fixed: 3 degrees of translational freedom. Rotational transitions– interatomic distances remain constant but the entire molecule rotates with respect to three mutually perpendicular axes: 3 rotational freedom (nonlinear), 2 rotational freedom (linear). Fundamental Vibrations Vibrations– relative positions of the atoms change while the average position and orientation of the molecule remain fixed.
Stretching and Bending • Types of Molecular Vibrations: Vibrations fall into the basic categories of stretching and bending. • Stretching vibration involves a continuous change in the inter-atomic distance along the axis of the bond between two atoms. • Bending vibrations are characterized by a change in the angle between two bonds and are of four types: scissoring, rocking, wagging, and twisting.
H2O: Stretching and Bending Vibrations • Bending is easier than stretching -- happens at lower energy (lower wavenumber) • Bond Order is reflected in ordering -- triple > double > single (energy) • with single bonds easier than double easier than triple bonds • Heavier atoms move slower than lighter ones
Examples of Vibrational Modes Example 1: Consider Water
Examples of Vibrational Modes Example 1: Consider Water Vibrations of water 3756 cm-1 1595 cm-1 3657 cm-1
Examples of Vibrational Modes Example 2: Consider Carbon Dioxide
Examples of Vibrational Modes Example 3: The Methylene Group It is important to note that there are many different kinds of bends, but due to the limits of a 2-dimensional surface it is not possible to show the other ones. A linear molecule will have another bend in a different plane that is degenerate or has the same energy. This accounts for the extra vibrational mode.
Selection Rules • A molecule will absorb infrared radiation if the change in vibrational states is associated with a change in the dipole moment () of the molecule. • Vibrations which do not change the dipole moment are Infrared Inactive (homonuclear diatomics). Homonuclear diatomic molecules (O2, N2, H2, Cl2) – IR Inactive Heteronuclear diatomic molecules (HF, HCl) – IR Active Dipole moment is greater when electronegativity difference between the atoms in a bond is greater. Some electronegativity values are: H 2.2; C 2.55; N 3.04; O 3.44; F 3.98; P 2.19; S 2.58; Cl 3.16
Infrared Spectrum of Carbon Dioxide (CO2) Stretching Bending
Asymmetric Stretching Vibration of the CO2 Fig. The asymmetric stretching vibration of the CO2 molecule, showing the fluctuation in the dipole moment. The asymmetric stretch is infrared active because there is a change in the molecular dipole moment during this vibration.
Symmetric Stretching Vibration of the CO2 To be "active" means that absorption of a photon to excite the vibration is allowed by the rules of quantum mechanics. [Aside: the infrared "selection rule" states that for a particular vibrational mode to be observed (active) in the infrared spectrum, the mode must involve a change in the dipole moment of the molecule.] The symmetric stretch is notinfrared active, and so this vibration is not observed in the infrared spectrum of CO2.
Bending motion of the CO2 Fig. The bending motion of the carbon dioxide molecule and its associated dipole fluctuation.
Infrared Spectroscopy The vibrational frequency is increasing with: • increasing force constant k (= increasing bond strength) • decreasing atomic mass
Infrared Spectroscopy increasing energy increasing frequency The vibrational frequency is increasing with: • increasing force constant k = increasing bond strength • decreasing atomic mass • Example: k cc > kc=c > kc-c
Infrared Spectroscopy for Structure Determination Divide the spectrum in to two regions: 4000 cm-1 1600 cm-1most of the stretching bands, specific functional groups (specific atom pairs). This is the “functional group”region. 1600 cm-1 400 cm-1many bands of mixed origin. Some prominent bands are reliable. This is the “fingerprint”region. Use for comparison with literature spectra.
Alcohols O–H stretch, hydrogen bonded 3500-3200 cm-1 C–O stretch 1260-1050 cm-1 (s) C-C stretches C–O stretch in same region as C–C but much more intense. O-H
phenethanol 1-phenylethanol Alcohols C–O–H stretch 3600 cm-1 in dilute solution Typically H-bonding and at lower frequency ~3400 cm-1 Position is sensitive to subs. pattern RCH2–OH 1050 cm-1 R2CH–OH 1110 cm-1 R3C–OH 1175 cm-1 Why O-H peak is broad? 2-piperidinylethanol
Ketones • C=O stretch: • aliphatic ketones 1715 cm-1 • alpha, beta-unsaturated ketones 1685-1666 cm-1
Carbonyl Compounds All carbonyl compounds absorb in the region 1760-1665 cm-1 due to the stretching vibration of the C=O bond.