Download
1 / 19
190 likes | 329 Views
Representation of the Sierra Barrier Jet in 11 years of a high-resolution dynamical reanalysis downscaling . Mimi Hughes 1,2 , Paul Neiman 2 , and Ellen Sukovich 1,2 , F Martin Ralph 2 March 13, 2012 CIRES, University of Colorado, Boulder, CO

E N D
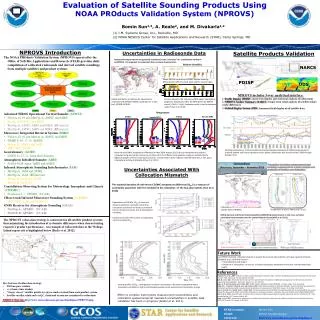
Representation of the Sierra Barrier Jet in 11 years of a high-resolution dynamical reanalysis downscaling Mimi Hughes 1,2, Paul Neiman 2, and Ellen Sukovich 1,2, F Martin Ralph2 March 13, 2012 CIRES, University of Colorado, Boulder, CO NOAA ESRL, Physical Sciences Division, Boulder, CO
Questions addressed • How well is the Sierra Barrier Jet (SBJ) and associated water vapor transport represented within data assimilation-constrained numerical models (i.e., reanalysis datasets and reanalysis dynamical downscalings) of varying resolutions? • How well are kinematic and thermodynamic properties represented in an 11-year WRF reanalysis downscaling?
Tools and Data used • Observations • 915 MHz wind profilers at 11 locations, primarily Chico, CA (CCO), which has 11 years of data • Supplemental radiosonde data at Sloughhouse (during 2005-2007) • Data assimilation-constrained numerical models • NCEP/NCAR Reanalysis Product (NNRP): 2.5 degree • North American Regional Reanalysis (NARR): 32 km • California Reanalysis Downscaling (CaRD10): 10 km • Weather Research and Forecast model reanalysis downscaling (WRF-RD): 6 km • SBJ objective identification tool detailed in Neiman et al. 2010.
Tools and Data used • WRF-RD: • 6 km horizontal resolution • 28 vertical layers • NARR as LBCs • 11 cool seasons have been run (2000-2011, Oct. - Mar.). • Run in 5 day, 3 hour increments (3-hours discarded as spin-up) • Only explicitly resolved convection in the innermost domain (KF in outer domain). • Morrison 2 moment microphysics • YSU PBL
Effect of resolution on SBJ representation Composites are constructed from 250, 204, 141, 159 (2001-2008 only), and 9 cases in the observations, WRF-RD, NARR, CaRD10, and NNRP, respectively. Sierra-perpendicular component (U) Sierra-parallel component (V) Height of ‘CCO’: reality: 41m WRF-RD: 41m NARR: 63.25m * NNRP: 733m *using second closest gridpoint
Effect of resolution on SBJ representation SBJ composite winds at 1000m in WRF-RD (left) and NARR (right) during 117 ‘triply matched’ SBJ cases. Colors show wind speed (m s-1); Vectors show speed and direction.
Effect of resolution on SBJ representation SBJ composite V (filled contours) and U (contour lines) for Sierra-perpendicular (top) and Sierra-parallel (bottom) cross sections in NARR (left) and WRF-RD (right). Colors show wind magnitude (m s-1).
Effect of resolution on SBJ water vapor transport SBJ composite Sierra-parallel (filled contours) and Sierra-perpendicular (contour lines) water vapor transport, for Sierra-perpendicular (top) and Sierra-parallel (bottom) cross sections in NARR (left) and WRF-RD (right). Colors show water vapor transport magnitude (kg m-2 s-1).
Effect of resolution on SBJ water vapor transport SBJ composite integrated water vapor transport, for NARR (left) and WRF-RD (right). Integral computed from the near-surface to 4 km. Colors show integrated water vapor transport magnitude (kg m-1 s-1).
Sierra Barrier Jet: WRF-RD/observation comparison The WRF altitude nearest 0 degrees Celsius (0degC; y-axis) compares very well with observed bright band height (BBH; x-axis). 0degC is expected to be 100-300 m above the BBH. Outliers in the upper left corner (WRF-RD>>obs) were inspected individually and found to mostly be incorrectly tagged by the objective BBH algorithm.
Sierra Barrier Jet: WRF-RD/observation comparison The WRF altitude nearest 0 degrees Celsius (0degC; y-axis) compares very well with observed bright band height (BBH; x-axis). 0degC is expected to be 100-300 m above the BBH. Outliers in the upper left corner (WRF-RD>>obs) were inspected individually and found to mostly be incorrectly tagged by the objective BBH algorithm. This comparison was made at each of the 11 wind profiler locations, on hours with objectively-tagged BBHs. At 10 of the 11 sites 0degC correlates with BBH at 0.8 or greater (near or above 0.9 at 6 sites). All 11 sites have additive biases between 100-300m, within the expected range given melt processes.
Sierra Barrier Jet: WRF-RD/observation comparison Observed (x-axis) and WRF-RD (y-axis) Sierra-perpendicular (U) and Sierra-parallel (V) wind speeds at Bodega Bay (BBY), 1000 m (top) and 2000 m (bottom) above ground level. Each point shows comparison for 1 hour from the 9 cool seasons of data at BBY. Red-dashed line shows x=y, green-dashed line shows linear fit. Correlation coefficient is shown in upper left of each panel.
Sierra Barrier Jet: WRF-RD/observation comparison Correlation at every altitude between observed and WRF-RD Sierra-perpendicular (left) and Sierra-parallel (right) wind at 11 wind profilers.
Sierra Barrier Jet: WRF-RD/observation comparison Observed (x-axis) and WRF-RD (y-axis) Sierra-parallel (V) wind speeds at Chico (CCO), at 1km AGL. Hours during SBJ conditions are highlighted by red.
Sierra Barrier Jet: WRF-RD/observation comparison Supplemental soundings at Sloughhouse during the 2005-2006 and 2006-2007 cool seasons during observed SBJ events (53 soundings) reveal that WRF-RD is not stable enough in the Central Valley during these events, which likely contributes to the weak bias of the SBJ (see Olson and Colle 2009).
Questions addressed • How well is the Sierra Barrier Jet (SBJ) represented within data assimilation-constrained numerical models (i.e., reanalyses and reanalysis dynamical downscalings) of varying resolutions? • Of the four reanalysis products investigated, WRF-RD has the most realistic representation of the SBJ vertically and spatially. • How well are kinematic and thermodynamic properties represented in the 11-year WRF-RD? • WRF-RD captures most of the hourly kinematic and thermodynamic atmospheric variability during the cool season. • Timing, altitude, and height of SBJ maximum V are well represented during most SBJ events, with a slight weak bias in amplitude worse for stronger jets. This weak bias is likely due at least in part to weaker vertical stability in the Central Valley during these events.
Up next: SBJ evolution, variability, and control processes: Climatological and case study perspectives Using the SBJ objective identification tool (Neiman et al. 2010) we identified SBJs that occur in both WRF-RD and wind profilers at CCO (Of 250/204 ‘original’ obs/WRF-RD cases, there are 150 'matched' cases). 127 of these events are well-represented in WRF-RD and will next be used to characterize 3D climatological characteristics of SBJ: • West-east spatial extent, frequency of southward penetration • Examination of the physical processes responsible for these characteristics, including kinematic versus diabatic forcing • Variability in these processes and associated SBJ variability • Fate of shallow cold pooling PBL air: How does the Central Valley cold pool modulate onset/maintenance of SBJ?