Download
1 / 19
200 likes | 393 Views
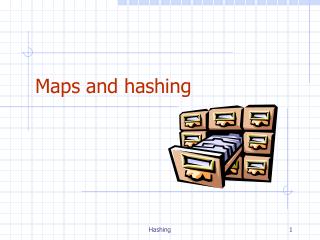
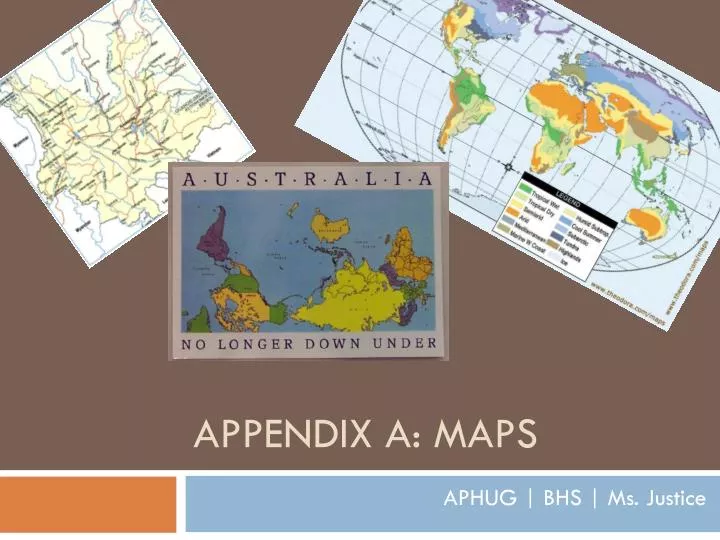
Appendix A: Maps. APHUG | BHS | Ms. Justice. Maps. Any map is an incomplete representation of reality: It is smaller than the world it represents It must depict a curved surface on a flat plane It contains symbols to convey information that must be transmitted to the reader

E N D
Appendix A: Maps APHUG | BHS | Ms. Justice
Maps • Any map is an incomplete representation of reality: • It is smaller than the world it represents • It must depict a curved surface on a flat plane • It contains symbols to convey information that must be transmitted to the reader • These are three fundamental properties of all maps: • Scale • Projection • Symbols
Map Scale • The scale of a map reveals how much the real world has been reduced to fit on the page or screen on which it appears • The ratio between actual distance and the length given to that distance on the map that can be represented: • Ratio (1:10,000) • Fraction (1/10,000) • Graphic form
Map Scale • "Large scale" refers to maps on which objects are relatively large, "small scale" to maps on which objects are relatively small.
Map Projections: Latitude & Longitude • Lines of latitude and longitude provide a frame of reference for cartographers Prime Meridian, Greenwich, England
Map Projections: Mercator Projection • Invented in 1859 by a Flemish cartographer • Cylindrical projection • Parallels and meridians cross at right angles • Direction is true everywhere on this map – excellent for navigation • Distortion grows toward the poles – continents appear stretched out and misshapen in higher latitudes
Map Projections: Robinson Projection • Developed by American cartographer Arthur Robinson in 1963 • Lines of longitude curve toward each other in polar regions • Substantially reduces the exaggerated size of polar land masses (better approximates shape) • Lacks the directional utility of the Mercator projections • Used by the National Geographic Society since 1988
Map Projections: Interrupted Projection • Broken meridians • Typically, breaks are designed to fall upon less important areas, like oceans • Equal-area map that avoids distortions or land masses
Symbols on Maps: Examples • Prominent dots = cities • Large dot w/a circle around it, or a star = capital • Red lines = roads • Double lines = 4 lane highways • Black lines = railroads • Blue = water • Green = forests • Etc.
Symbols on Maps: Dot Map • A dot map shows a spatial representation • On this map, each dot represents the location of a commercial cell phone tower in the U. S.
Symbols on Maps: Contour Map • Lines represent a certain consistent height above sea level
Other Maps: Flow-Line Maps • Good for determining movement – such as migration
Other Maps: Choropleth Maps • Put data into a spatial format. • Useful for determining demographic data, by assigning colors or patterns to areas
Other Maps: Cartograms • Chart and assign data by size World population World child mortality