Download
1 / 4
40 likes | 156 Views
Kyoto Gap through to 2012. Source: Point Carbon. AAU supply and demand. AAU supply and demand. Intro, sense of market and buyers Sense of AAU market structure Buyers and sellers expectations

E N D
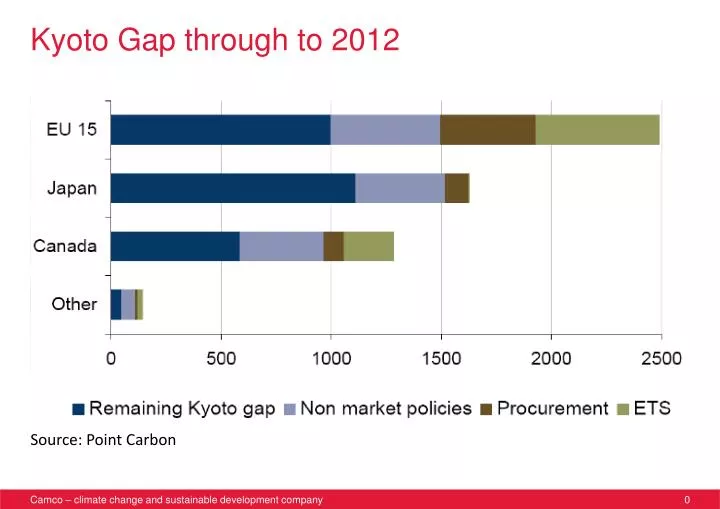
Kyoto Gap through to 2012 Source: Point Carbon
AAU supply and demand • Intro, sense of market and buyers • Sense of AAU market structure • Buyers and sellers expectations • AAUs, GIS vs JI track 1, 2, [flexibility, additionality] and the difference in European context, different buyers. • Policy context and development (important issues related to AAU trading market – “hot air” and “hard greening”) • Volumes and potential size of market – potential supply and demand • It’s a buyers market – first mover advantage for sellers. • Major players (Japanese, EBRD, CEE)