Download
1 / 25
250 likes | 407 Views
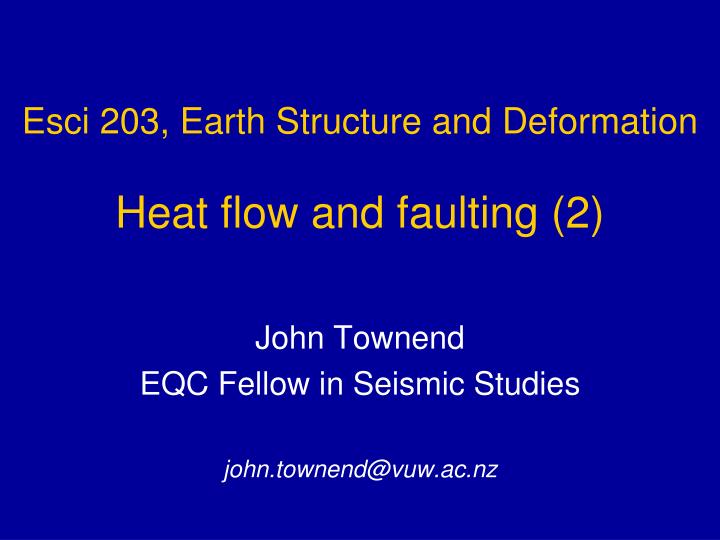
Esci 203, Earth Structure and Deformation Heat flow and faulting (2). John Townend EQC Fellow in Seismic Studies john.townend@vuw.ac.nz. Outline. Recap on the last lecture Conductive heat flow and the heat flow equation Measuring surface heat flow The brittle-ductile transition

E N D
Esci 203, Earth Structure and DeformationHeat flow and faulting (2) John Townend EQC Fellow in Seismic Studies john.townend@vuw.ac.nz
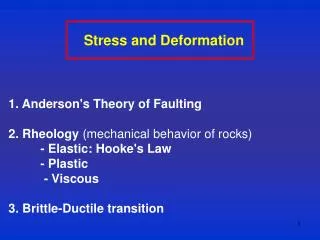
Outline • Recap on the last lecture • Conductive heat flow and the heat flow equation • Measuring surface heat flow • The brittle-ductile transition • Characteristic times • Interpreting heat flow maps • Inferring paleoclimates from heat flow data • Shear heating and the San Andreas paradox
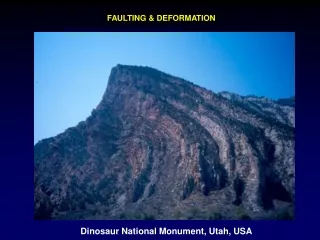
Shallow geotherm Temp. gradient: 63 ± 2°C km–1 Heat flow: 158 ± 69 mW m–2 Photo: D.L. Homer
L Characteristic time/length scales • When’s breakfast? Characteristic time, t = L2/ • So, if the rock is 20 cm thick, and k=10–6 m2 s–1, then it takes ~40,000 s (or ~11 hours) for substantial heat to be conducted through the slab
Muller et al., 2008. Geo3 Age of oceanic lithosphere
Ocean depth is related to the age of oceanic lithosphere, which cools and sinks as it propagates from a MOR dkm ~ 2.6 + 0.36tMyr
Elevation below sea-level Thermal structure Density structure Assuming isostatic eqbm. Why? • We can relate water depth and age (√t) using models of cooling • Half-space model (lithospheric thickness defined by temperature) • Plate model (lithospheric thickness specified) • The models differ in their boundary conditions
Kelvin’s model of the Earth • Assumptions: • The Earth is flat • The Earth’s surface temperature has always been 0°C • The Earth’s interior temperature was initially 4000°C • Answer: • 20–400 Ma, with a final preference for ~24 Ma
It never rains but it pours... • “[T]he inexorable physicist [has] remorselessly struck slice after slice for his allowance of geological time.” — Sir Archibald Geikie, 1892 • “[T]he geologist who ten years ago was embarrassed by the shortness of time allowed to him for the evolution of the earth’s crust is now still more embarrassed by the superabundance with which he is confronted.” — Arthur Holmes, Nature, 1913
Blackwell, D. D., and Richards, M. 2004. Geothermal Map of North America. American Assoc. Petroleum Geologist (AAPG), 1 sheet, scale 1:6,500,000.
Australian heat flow provinces Beardsmore and Cull, 2001
Paleoclimate research • Changes in temperature at the ground surface propagate downwards over time • If that’s the case, then we should be able to deduce what ground surface temperature changes have occurred in the past using borehole measurements of temperature vs. depth • This is called an inverse problem
Background Temperature fluctuations of longer period propagate to greater depth The depth at which the amplitude of the perturbation is 0.37the value at the surface is known as the “skin depth” If P is the period of the perturbation, then the skin depth d is Pollack and Huang, 2008
Borehole temperature profiles Perturbed shallow sections Undisturbed background geotherms The task is to relate T(z,t=0) to T(z=0,t) Pollack and Huang, 2008
A global compilation Analysis of global borehole measurements yields a record that can be used to extend instrumental records back in time Pollack and Huang, 2008
Just like when you rub your hands together, rocks sliding past each other along a fault are frictionally heated The amount of heat generated depends on: How fast the fault is slipping How much frictional stress is resisting slip Shear heating
Do big faults generate much heat? • The San Andreas slips at 20–30 mm/yr and we’d expect it to generate substantial shear heating ... unless the frictional stresses were low • So, can we measure a temperature anomaly across the San Andreas fault?
The source of the controversy Fulton et al., GRL, 2004
Is there some heating we’re missing? Perhaps shallow groundwater flow washes out the shear heating signal But, most plausible groundwater scenarios mean that we should see shear heating if it’s there Fulton et al., GRL, 2004
IODP Expedition 343Japan Trench Fast Drilling Project (JFAST)
Science team 28 scientists from 10 countries (Japan, US, UK, Canada, Germany, France, Italy, China, India, NZ) Geologists, geophysicists, geochemists, one microbiologist
Suggested reading material • Fowler (2004) • Chapter 7, particularly §7.1, (7.2–7.3), 7.5.1, 7.8 • Mussett and Khan • Chapter 17, particularly §17.1, 17.2, 17.4 • Beardsmore and Cull (2001) • Any or all of chapters 1–3 • Turcotte and Schubert (1982) • Section 4.1 Not on reserve (see me)