Download
1 / 65
650 likes | 781 Views
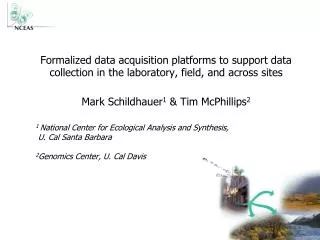
Observations and Ontologies Achieving semantic interoperability of environmental and ecological data. Mark Schildhauer 1 , Shawn Bowers 2 , Josh Madin 3 , Matt Jones 1 1 NCEAS UC Santa Barbara, 2 Gonzaga University 3 Macquarie University,. http://sonet.ecoinformatics.org.

E N D
Observations and Ontologies Achieving semantic interoperability of environmental and ecological data Mark Schildhauer1, Shawn Bowers2, Josh Madin3, Matt Jones1 1NCEAS UC Santa Barbara, 2Gonzaga University3Macquarie University, http://sonet.ecoinformatics.org NCEAS-ACEAS Workshop, Brisbane May 2010
Motivation-- Critical questions Need to answer increasingly complex and critical questions about the environment: are the world’s fisheries sustainable? how will climate change impact food production? are GMOD crops safe to introduce to the environment? is deforestation accelerating climate change? why are pollinators declining around the world? will nanotech wastes alter ecosystems? what are causes of ocean acidification on reef corals? can we predict the spread of an invasive species are there tipping points in environmental change?
Motivation– Environmental Synthesis Answering complex, critical environmental questions requires integrating and analyzing many types of data: Local to large scale, global coverages Fine-grain, high-resolution Physical context: land-use/land-cover, geology soils, atmosphere, hydrology, oceanography Biotic context: from genes to ecosystems Socioecology: traditions & customs, economics, governance
Good news-- more and more data There is a growing deluge of environmental data to assistin these investigations …
Need for ecoinformatics But… • locating desired information is already quite difficult… • Culling through irrelevant information (precision) • Failing to find all useful information (recall) • using the data you find is problematic… • Interpretation (units, context, methods) • Merging, transforming for re-use • Manual, ad-hoc, arduous … Why?
Environmental Data-- State of Affairs Environmental data are: • Stewarded/owned by many groups, individuals • Sparsely documented (metadata, data catalog) • Variably accessible via the Internet • Heterogeneous: broad range of relevant topics
The informatics challenge… Environmental data are highly heterogeneous… geospatial data-- point, line, polygon, raster time series/monitoring data tables, spreadsheets/csv grids, matrices normalized DBMS • Variable structure • Variable syntax (R, MATLAB, mySQL, .xls) • Variable semantics (what is “temp”?)
Data Integration • Combining heterogeneous data is necessary for synthesis • Approaches • Develop consistent data models within and across entire domains– “standardized schema” • “Describe” your data and its contents so that machines can process and integrate– “semantic mediation”
Data Integration • Combining heterogeneous data is necessary for synthesis • Impractical if not impossible to standardize schemas for all data sets being collected • Use emerging approaches of Semantic Web1 1 Berners-Lee, Hendler & Lassila 2001. The Semantic Web. http://www.scientificamerican.com/2001/0501issue/0501berners-lee.html [18.04.2002 21:56:54]
Semantic Data Integration • Metadata standards are step in right direction… Expose data in standard schema for transfer • Dublin Core • ISO 19115 (geospatial metadata) • Darwin Core (biodiversity specimen metadata) • EML (Ecological Metadata Language) • GeoSciML • All have XML implementations for document exchange • Can map one format to another to resolve minor differences
Importance of semantics • Descriptive metadata is insufficient • “semantics” are expressed in natural language • Inconsistent, imprecise, not standardized • The computer can’t “understand”: • what is being measured • how measurements relate to one another • how semantics map to logical structure
Importance of semantics • Efficient, effective integration and subsequent analysis depends on understanding the semantic contextual relationships of each data measurement, as well as the relationships among measurements in a table structure or other data format. • Usually an expert provides this, or a data catalog • How to capture and expose for machine processing? • Semantic Mediation!
Semantic Data Integration Metadata-- • Cannot formally express complex constructs: • Define Specific Leaf Area • What type of weight measurement is involved in its calculation? • How is SLA measurement in column 1 related to plot ID measurement in column 2? • Cannot provide native reasoning: • I measured a specimen with a prehensile tail, extrusible tongue, eats insects, has fused toes • What is it? Can I know anything more about it?
Semantic Data Integration • Ontologies do not have these limitations… • Can express complex constructs: • SLA is an abbreviation that is a synonym for the functional trait called Specific Leaf Area that is a measurement taken from a leaf, which is a part of a plant • SLA consists of a dry weight measurement divided into an areal measurement • Can natively reason: • The specimen has a prehensile tail, extrusible tongue, eats insects, has fused toes infer: specimen is a chameleon infer: chameleon is a reptile infer: specimen has stereoscopic eyes Infer: specimen may be able to change color
Formal Ontologies and Reasoners • Use W3C standard: Semantic Web • http://www.w3.org/standards/semanticweb/ • Expose data syntax, schema and semantics through astandardized language that computers can parse and interpret: OWL, the WebOntology Language • OWL, RDF, XML • Reasoners
What is an ontology? A formal specification of concepts, and the relationships that may exist between those concepts.
How can ontologies help? • Classification and “reasoning” • Data discovery • Integration/merge • Concept mapping • Units conversion • Spatial & temporal scaling
If have Area and Abundance, might have ArealDensity ArealDensity requires knowledge of Area and Abundance How can ontologies help? • Classification and “reasoning” • New “facts” derived from ontology • Potential emergence
How can ontologies help? • Classification and “reasoning” • Data discovery • Integration/merge • Analytical assistance • Statistical inference • Data types • Data transformations
How can ontologies help? • Use OWL-DL (OWL2 RL) W3C Recommendation • Provides complete and consistent reasoning • Standard, free, reasoners available • Pellet, FaCT++ • Construct and visualize ontologies using free tools • Protégé, SWOOP • OWLIFIER tool (Josh)
How can ontologies help? • Can “Define” Objects with equivalence classes • Specifies Necessary and Sufficient Conditions • Reasoner will classify described Object has Fur locomotes Bipedal native_to Australia births UndevelopedYoung has GoodJumpingAbility
What do ontologies consist of? • Objects (terms) • Arrange in class (subsumption) hierarchies • Can describe objects in terms of properties and relationships to other objects • Relationships • Specify relationships between Objects • Can be reflexive, symmetric, transitive (or not)
Beyond SQL… OWL DL Symbol Example Restrictions: someValuesFrom ∃ hasPart some Leaf allValuesFrom ∀ isPartof only Plant hasValue ∋ hasCountryOfOrigin value Australia minCardinality ≥ hasStoma min 1 cardinality = hasStem exactly 1 maxCardinality ≤ hasPetals max 100 Class constructors: intersectionOf ⊓ WoodyBark and RiparianHabitat unionOf ⊔ Tree or Bush complementOf ¬ not Grass
Model and define domain science concepts • Lots of domain ontologies emerging • http://www.biofoundry.org • How to use these to advance data integration?
Model and define domain science concepts • http://www.biofoundry.org • Mainly biomedical, genomics
Use of Ontologies • Genomics have largely homogeneous data • Ontologies “unify” vocabularies in model organisms • (fruit fly, yeast, mouse, arabidopsis etc.) • Many ontologies emerging • Are these useful for semantic mediation and data integration?
Nature of scientific data sets • Scientific data often in tables • Tables consist of rows (records) and columns (attributes) • The association of specific columns together (tuple) in a scientific data set is often a non-normalized (materialized) view, with special meaning/use for researcher • Individual cells contain values that are measurements of characteristic of some thing
Semantic annotation • computer doesn’t know that “Ht.” represents a “height” measurement • computer doesn’t know whether Plot is nested within Site or vice-versa • computer to determine if the Temp applies to Site or Plot or Species Data set slide from J. Madin
Observation defined Observations in scientific data sets typically co-occur with other observations Ontologies must assist with describing the inter-relationships among observations within and across datasets Observational Data Model
Observation defined An observation represents any measurement of some characteristic (attribute) of some real-world entity or phenomenon. A measurement consists of a realized value of some characteristic of an entity, expressed in some well-specified units (drawn from a measurement standard) Observations can provide context for other observations (e.g. observations of spatial or temporal information would often provide context for some other observation) Measurements are taken using some protocol
Another definition for observation • An observation is an act that results in the estimation of the value of a feature property, and involves application of a specified procedure, such as a sensor, instrument, algorithm or process chain. The procedure may be applied in-situ, remotely, or ex-situ with respect to the sampling location…The key idea is that the observation result is an estimate of the value of some property of the feature of interest, and the other observation properties provide context or metadata to support evaluation, interpretation and use of the result. (OGC Observations and Measurements, 2010-01-05)
Extensible Observation Ontology (OBOE) • A scientific Observation is • Measurement of the Value • of a Characteristic • of some Entity • in a particular Context • using some Protocol
Extension points OBOE - Extensible Observation Ontology Observations can provide context for other observations. To generically describe the structure of scientific observation and measurement as would be found in a scientific data set Entities represent real-world objects or concepts that can be measured. Observations are made about particular entities. Entities, through observations, can be associated with one or more measured characteristics. Every measurement has a characteristic, which defines the property of the entity being measured. Measurements assign values and units to characteristics of observed entities. Every measurement has a unit. Provides extension points for loading specialized domain ontologies A value is typically a cell in a data set.
Linking data values to concepts • Extensible Observation Ontology (OBOE) • OBOE provides a high-level abstraction of scientific observations and measurements • Enables data (or metadata) structures to be linked to domain-specific ontology concepts • Can inter-relate values in a tuple • Provides clarification of semantics of data set as a whole, not just “independent” values
Ecological Paleontological OBOE - Domain concepts
OBOE - Units Standard and customized units and their relationships to one another can easily be loaded into OBOE
OBOE - Semantic units Measurements can be of one or more characteristics of one or more entities (unit components)
Plant measured in StudyArea StudyArea is on the Plant OBOE - Context Context provides essential semantic detail by linking Observations
OBOE - Context • Experimental design • Spatial & temporal scaling • “Smart” data merge • “Sensible” analysis
OBOE - Context • Experimental design • Spatial & temporal scaling • “Smart” data merge • “Sensible” analysis
Data Integration with OBOE • Observations can be aligned for data integration ... Observation Measurement Diameter has-precision has-value Tree 0.1 1.3 Meters 3.2 • Apply conversions based on alignments, e.g. • use common Entity and Characteristic concepts • apply Unit conversions to values • select lowest precision and apply
OBOE: Aligning Observations • Observations can be aligned for data integration ... Observation Measurement Diameter has-precision has-value Picea rubens 0.01 1.25 Meters Two similar observations of trees Abbies balsa. 10 320 Centimeters has-value has-precision Observation Measurement DBH
OBOE: Aligning Observations • Observations can be aligned for data integration ... Observation Measurement Diameter has-precision has-value Picea rubens 0.01 1.25 Meters Align entities, characteristics, and standards isa has-dimension isa Tree Length isa has-dimension Abbies balsa. 10 320 Centimeters has-value has-precision Observation Measurement DBH
Observation Based Structured Query • Both datasets contain “tree lengths” • Annotation search for “tree length” would return both datasets • Structured search allows the search to be limited by the observed entity (e.g. a tree or a tree branch) • Increase precision and recall
IS sensible to summarize variables by factors in the same Observation; e.g., Plant Height by TaxonomicName or Precipitation by StudySite NOT sensible to summarize variables by “downstream” factors; e.g., Precipitation in the StudySite by TaxonomicName IS sensible to summarize variables by “upstream” factors; e.g., Plant Height by StudySite or by Precipitation Example: “Sensible” data summarization • Leveraging annotations • Consistency checking
Our Semantic Approach • Climbing the semantic ladder: Ontologies Semantic Annotations Metadata Data
Our Semantic Approach • Method for linking elements of data objects (e.g., columns in a table) to consistent and potentially rich sets of concepts • Semantic Annotations link EML attributes to concepts defined in a Formal Ontology • Store and retrieve annotations and ontologies in Metacat
Semantic Annotation Links data structures via metadata, to ontology terms via OBOE Actively working on materializing data result sets from these ontology-based queries Investigating expressiveness of annotation language Annotating to other data stores