Download
1 / 16
210 likes | 647 Views
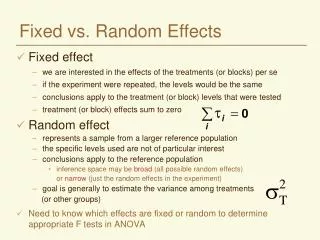
Fixed vs. Random Effects. Fixed effect we are interested in the effects of the treatments (or blocks) per se if the experiment were repeated, the levels would be the same conclusions apply to the treatment (or block) levels that were tested treatment (or block) effects sum to zero

E N D
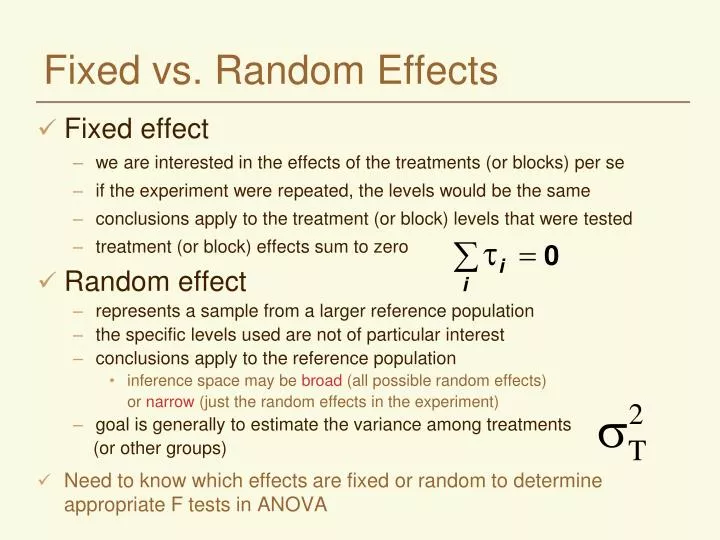
Fixed vs. Random Effects • Fixed effect • we are interested in the effects of the treatments (or blocks) per se • if the experiment were repeated, the levels would be the same • conclusions apply to the treatment (or block) levels that were tested • treatment (or block) effects sum to zero • Random effect • represents a sample from a larger reference population • the specific levels used are not of particular interest • conclusions apply to the reference population • inference space may be broad (all possible random effects) or narrow (just the random effects in the experiment) • goal is generally to estimate the variance among treatments (or other groups) • Need to know which effects are fixed or random to determine appropriate F tests in ANOVA
Fixed or Random? • lambs born from common parents (same ram and ewe) are given different formulations of a vitamin supplement • comparison of new herbicides for potential licensing • comparison of herbicides used in different decades (1980’s, 1990’s, 2000’s) • nitrogen fertilizer treatments at rates of 0, 50, 100, and 150 kg N/ha • years of evaluation of new canola varieties (2008, 2009, 2010) • location of a crop rotation experiment that is conducted on three farmers’ fields in the Willamette valley (Junction City, Albany, Woodburn) • species of trees in an old growth forest
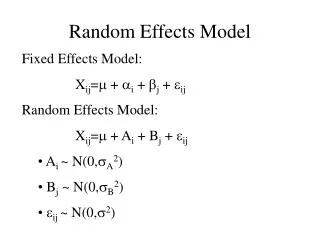
2 2 s + s r e T s 2 e Fixed and random models for the CRD Yij = µ + i + ij variance among fixed treatment effects Expected Source df Mean Square Fixed Model (Model I) Treatment t - 1 s + 2 2 r e T s Error tr - t 2 e Expected Source df Mean Square Random Model (Model II) Treatment t - 1 Error tr - t
Models for the RBD Yij = µ + i+j+ ij Fixed Model Random Model Mixed Model
Nested (Hierarchical) Designs • Levels of one factor (B) occur within the levels of another factor (A) • Levels of B are unique to each level of A • Factor B is nested within A Factor A = the pigs (sows) Factor B = the piglets • Nested factors are usually random effects
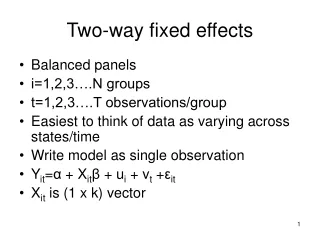
Nested vs. Cross-Classified Factors Nested Cross-classified B1 B2 A1 A2 A3 B1 B2 B3 B4 B5 B6 A1 A2 A3 X X X X X X Each unit of B is unique to each unit of A All possible combinations of A and B General form for degrees of freedom B nested in A a(b-1) A*B (a-1)(b-1)
Sub - Sampling • It may be necessary or convenient to measure a treatment response on subsamples of a plot • several soil cores within a plot • duplicate laboratory analyses to estimate grain protein • Introduces a complication into the analysis that can be handled in one of two ways: • compute the average for each plot and analyze normally • subject the subsamples themselves to an analysis • The second choice gives an additional source of variation in the ANOVA – often called the sampling error
Use Sampling to Gain Precision • When making lab measurements, you will have better results if you analyze several samples to get a truer estimate of the mean. • It is often useful to determine the number of samples that would be required for your chosen level of precision. • Sampling will reduce the variability within a treatment across replications.
Stein’s Sample Estimate Where t1 is the tabular t value for the desired confidence level and the degrees of freedom of the initial sample d is the half-width of the desired confidence interval s is the standard deviation of the initial sample
For Example If we collected and ran five samples from the same block and same treatment, we might obtain data like that above. We decide that an alpha level of 5% is acceptable and we would like to be able to get within .5 units of the true mean. The formula indicates that to gain that type of precision, we would need to run 14 samples per block per treatment. Suppose we were measuring grain protein content and we wanted to increase the precision with which we were measuring each replicate of a treatment.
Linear model with sub-sampling • For a CRD Yijk= + i + ij + ijk = mean effect i = ith treatment effect ij = random error ijk= sampling error • For an RBD Yijk= + i + j + ij + ijk = mean effect βi = ithblock effect j = jth treatment effect ij = treatment x block interaction, treated as error ijk= sampling error
Expected Mean Squares – RBD with subsampling • In this example, treatments are fixed and blocks are random effects • This is a mixed model because it includes both fixed and random effects • Appropriate F tests can be determined from the Expected Mean Squares
The RBD ANOVA with Subsampling Source df SS MS F Total rtn-1 SSTot = Block r-1 SSB= SSB/(r-1) Trtmt t-1 SST = SST/(t-1) FT = MST/MSE Error (r-1)(t-1) SSE = SSE/(r-1)(t-1) FE = MSE/MSS Sampling ErrorSSS = SSS/rt(n-1) rt(n-1) SSTot-SSB-SST-SSE
Means and Standard Errors Standard Error of a treatment mean Confidence interval estimate Standard Error of a difference Confidence interval estimate t to test difference between two means
Significance Tests • MSS estimates • the variation among samples • MSE estimates • the variation among samples plus • the variation among plots treated alike • MST estimates • the variation among samples plus • the variation among plots treated alike plus • the variation among treatment means • Therefore: • FE • tests the significance of the variation among plots treated alike • FT • tests the significance of the differences among the treatment means
Allocating resources – reps vs samples • Cost function C = c1r + c2rn • c1 = cost of an experimental unit • c2 = cost of a sampling unit • If your goal is to minimize variance for a fixed cost, use the estimate of n to solve for r in the cost function • If your goal is to minimize cost for a fixed variance, use the estimate of n to solve for r using the formula for a variance of a treatment mean See Kuehl pg 163 for an example