Download
1 / 28
280 likes | 442 Views
Compositional Interpretation of PFS/ MEx and TES/MGS Thermal Infrared Spectra of Phobos. M. Giuranna 1 , T. L. Roush 2 , T. Duxbury 3 , R. C. Hogan 4 , C. Carli 5 , A . Geminale 1 , V. Formisano 2

E N D
Compositional Interpretation of PFS/MEx andTES/MGS Thermal Infrared Spectra of Phobos • M. Giuranna1, T. L. Roush2, T. Duxbury3, R. C. Hogan4, • C. Carli5, A. Geminale1, V. Formisano2 • IstitutodiFisicadelloSpazioInterplanetario INAF-IFSI, Via del Fosso del Cavaliere 100, 00133 Roma, Italy • NASA Ames Research Center, MS 245-3, Moffett Field, CA 94035-1000 USA • Jet Propulsion Laboratory, California Institute of Technology, 4800 Oak Grove Drive, Pasadena, 91109 California • Bay Area Environmental Research Institute, C/O MS 245-3, Moffett Field, CA 94035-1000 USA • Isituto di Astrofisica Spaziale e Fisica cosmica INAF-IASF, Via del Fosso del Cavaliere 100, 00133 Roma, Italy The First Moscow Solar System Symposium , 11 – 15 October 2010, Moscow, Russia
Formation Scenarios and their compositional implications The origin of the Martian satellites presents a puzzle of long standing. Addressing the composition of Phobos will help constrain theories of its formation. The First Moscow Solar System Symposium , 11 – 15 October 2010, Moscow, Russia
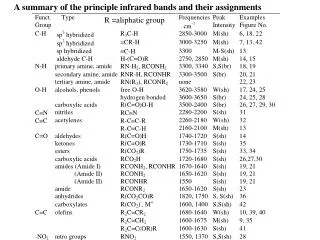
TES/MGS and PFS/MEx TES is a Michelson interferometer operating from 1700 to 200 cm-1 (~6 to 50 mm) with spectral resolutions of 6.25-12.5 cm-1 (Christensen et al., 1992, 1998). PFS is a Fourier spectrometer working in two different channels. The SWC covers wavenumbers from 1700 to 8200 cm−1 (1.2–5.9 μm) while the LWC operates in the range 250–1700 cm−1 (5.9–40 μm). The spectral resolution is 1.3 cm−1 when no apodization function is applied, and about 2 cm−1 when Hamming function is applied to the interferograms. In the present analysis we use data from LWC. At these wavelengths, both instruments can detect the fundamental vibrational modes of materials. The number, position, intensity, and shape of which are dependent upon the atomic masses, inter-atomic force fields, and molecular geometry, providing a sensitive means of determining mineralogy. The First Moscow Solar System Symposium , 11 – 15 October 2010, Moscow, Russia
Available Data: TES/MGS *>50% of pixel filled with Phobos The MGS mission was designed chiefly to investigate the surface and atmosphere of Mars (Albee et al., 1998). During the science phasing orbital period there were several opportunities to observe Phobos (see Table 2). The first three were essentially hemispherical observations of Phobos’ unilluminated hemisphere. However, the final encounter (orbit 551) provided modest spatial resolution of the surface of Phobos during which TES acquired several spectra of Phobos. The First Moscow Solar System Symposium , 11 – 15 October 2010, Moscow, Russia
Available Data: PFS/MEx In observing Phobos, MEx benefits from its highly elliptical orbit allowing observations of both the planet-facing and the far side of the moon. PFS had several opportunities to observe Phobos. In particular, between July and September 2008 the MEx spacecraft made a series of eight flybys of Phobos at distances ranging from 4500 km down to 93 km from the centre of the moon. For our analysis we selected orbits with the closest possible approach, in order to have Phobos always larger than, or at least comparable to, the FOV of PFS. Four orbits satisfy these criteria, as summarized in Table 3. The First Moscow Solar System Symposium , 11 – 15 October 2010, Moscow, Russia
Available Data: PFS/MEx In each orbit PFS observes a different region of the Phobos’ surface. A simulation of Phobos during the four PFS observations is shown in Figure. The PFS footprint has been super-imposed on each of the images. The simulated images of Phobos were created by illuminating a shape model consisting of a harmonic expansion (Willner et al., 2009) with craters superimposed (Duxbury, 1989). The First Moscow Solar System Symposium , 11 – 15 October 2010, Moscow, Russia
Data Reduction: TES • A linear combination of 3 black bodies is used to perform a least squares fit • Using these results as inputs, an upper hull is fit to the radiance maxima • Emissivityvalues are produced by dividing the measured radiance by the hull. • The derived temperatures can be compared with those of PFS The First Moscow Solar System Symposium , 11 – 15 October 2010, Moscow, Russia
Data Reduction: PFS • Hamming apodization function is applied to the interferograms. • spectra within the same orbit are averaged together (4 final spectra). • The resulting spectra are smoothed over thirteen points. The actual noise is shown as error bars, one every 5 spectral points. The First Moscow Solar System Symposium , 11 – 15 October 2010, Moscow, Russia
Comparison of TES & PFS Surface Temperatures PFS min and max derived surface temperatures: 130-160 K and 290-353 K. Good agreement with the minimum (night, 140 K) and maximum (day, 300 K) brightness temperatures of the satellite surface derived from Viking measurem.s (Lunine et al., 1982) Compared to the temperatures derived (Earth-based observations) for Phobos by Lynch et al. (2007, 320-340 K), only those for PFS orbit 6906 approach these values. The explanation for this systematic difference is that during the observations of Lynch et al. (2007) Mars’ heliocentric distance was ~1.38-1.39 AU. The First Moscow Solar System Symposium , 11 – 15 October 2010, Moscow, Russia
Comparison of Temperatures with models We compare our results with the results of the numerical modeling of the thermal regime of Phobos’ surface regolith layer (on seasonal time scales) in Kuzmin and Zabalueva (2003). There is a general good agreement, as our derived temperatures are mostly within the range of predicted diurnal temperatures on the Phobos surface, and the variation of surface temperature as predicted by the model is also reproduced by our results. However, our max derived temperature is ~20 K higher than the max diurnal temperature predicted. The First Moscow Solar System Symposium , 11 – 15 October 2010, Moscow, Russia
TES Spectra Orbit 551 TES spectra with similar properties are combined into clusters. Statistical information is associated with each cluster (e.g., mean, variance, etc.). Most spectra fell into one of four groups that are spatially associated with areas located 1) on the rim; 2) on the floor; 3) in the grooves to the east; and 4) to the northeast, of Stickney crater. The emissivities of the four regions were averaged and used as representative spectral measurements in the compositional efforts. The First Moscow Solar System Symposium , 11 – 15 October 2010, Moscow, Russia
PFS Spectra TF By chance, the same region, namely the area located to the northeast of Stickney crater, has been observed by both TES and PFS. The two spectra look extremely similar, showing essentially the same bands in the same positions, with similar widths and relative depths. The First Moscow Solar System Symposium , 11 – 15 October 2010, Moscow, Russia
Analyses approaches Our compositional interpretation of thermal emission data relies upon several digital spectral libraries. One contains measured emissivity for a variety of materials (carbonates, nitrates, borates, halides, oxides, phosphates, arsenates, vanadates, sulphates, chromates, molybdates and silicates), (TES library). Additionally, a digital library containing spectra of terrestrial rocks, lunar materials, and various meteoritesreflectivities was used (ASTER spectral library). The RELAB spectral library is also used for comparison (Pieters and Hiroi, 2004). It contains spectra of lunar samples. Additionally, we compared Phobos spectra with a limited number of materials that are residues of the processing of various organic precursors (Cruikshank et al., 1991). Such samples are analogs for the processed products of ultraprimative materials found in the outer solar system. The First Moscow Solar System Symposium , 11 – 15 October 2010, Moscow, Russia
Surface Compositional Interpretations Results are dominated by Phyllosilicatesfor all classes Mostly Micas (Biotite) Antigorite The First Moscow Solar System Symposium , 11 – 15 October 2010, Moscow, Russia
Surface Compositional Interpretations Phyllosilicate, Rocks, Lunarsamples Ijolite: the sample from which the powder was derived is a dark gray to black, medium-to coarse- grained rock composed of Nepheline, Biotite, a black mafic mineral and opaques. The First Moscow Solar System Symposium , 11 – 15 October 2010, Moscow, Russia
Surface Compositional Interpretations Phyllosilicates (Tectosilicate?) Phyllo Mixture: 50% Biotite + 50% Antigorite Nepheline: Unusually dark gray The First Moscow Solar System Symposium , 11 – 15 October 2010, Moscow, Russia
Surface Compositional Interpretations TES observations allow evaluation of the position of the Christiansen frequency(CF) that has been related to rock type (Salisbury and Walters, 1989). Using the entries in Table 2 of Salisbury and Walter (1989) that lists the CF of rocks observed in a vacuum, we created an average for several igneous rock types. These are shown as the points with 1 standard deviations in Figure. We used the 4 classes of spectra identified from the region in and around Stickney for comparison to these points. For each class we fit the data in the 7.1-9.8 mm wavelength region using a quadratic curve. The results are shown as the large letters in Figure. It is clear that all the classes are consistent with the range of CF values associated with ultramafic rocks. The First Moscow Solar System Symposium , 11 – 15 October 2010, Moscow, Russia
Surface Compositional Interpretations CF vs SiO2 content (ASTER library) compared to CF calculated for TES spectra observed near Stickney The First Moscow Solar System Symposium , 11 – 15 October 2010, Moscow, Russia
Surface Compositional Interpretations The First Moscow Solar System Symposium , 11 – 15 October 2010, Moscow, Russia
Surface Compositional Interpretations Feldspars? ASTER Library TES Library This is the only spectrum that can not be matched by phyllosilicates. Only Tectosilicates (Feldspars) provide reasonable-to-good matches. The First Moscow Solar System Symposium , 11 – 15 October 2010, Moscow, Russia
TES average spectrum for selected observations during orbit 526 TES footprints cover the PFS footprint for Orbit 5851. The two measured spectra look very similar. This supports the indication of feldspars on the surface of Phobos. The First Moscow Solar System Symposium , 11 – 15 October 2010, Moscow, Russia
METEORITES: Poor Matches Meteorites “best” matches The First Moscow Solar System Symposium , 11 – 15 October 2010, Moscow, Russia
Two different portions of a black chondrite (Paragould, LL5) The First Moscow Solar System Symposium , 11 – 15 October 2010, Moscow, Russia
Conclusions (1/3) • The lack of deep absorption features in the VNIR spectra of Phobos have allowed a number of possible analogs to be ruled out, though they have also made it difficult to make any positive identifications. • Our observations in the thermal infrared showseveral spectral featuresthat have been used to investigate the composition of the surface. • Our results show that the majority of the spectra are consistent with a dominance of phyllosilicate, particularly in the areas around Stickney crater (“blue” units). • Some spectra also suggest the presence of Feldspars/Feldspathoids (“red” units). • The spectral compositional results suggest ultramafic assemblages. This is consistent with the position of the CF in the TES data that suggests ultramafic rock types. • Meteorites spectra provide poor matches. Achondrites? • Twoindependent approaches of compositional analyses yield very similar results. The First Moscow Solar System Symposium , 11 – 15 October 2010, Moscow, Russia
Conclusions (2/3) • Our results show that the surface temperature of Phobos varies with solar incidence angle and heliocentric distance, reconciling different results (Viking, Lunine et al. 1982; Earth-based, Lynch et al. 2007; models, Kuzmin and Zabalueva 2003). • The lack of consistency of the PFS and TES spectra to analogs of ultraprimitive materials (organic residues) suggests that an origin via capture of a TNO object is not supported by these observations. • Silicates: silicate material on Phobos yield high porosity content (see P. Rosenblatt), which seem difficult to reconciliate with the capture scenario, but is required in order to absorb the energy of the large impact that generated Stickney without destroying the body. High porosity is an expected consequence in some scenarios of in-situ formation, e.g., re-accretion process. • Phobos may represent a case analogous to that of Mercury, where the use of mid-IR emissivity spectra can improve surface compositional interpretations. The First Moscow Solar System Symposium , 11 – 15 October 2010, Moscow, Russia
Conclusions (3/3) In Table 1 we collect and summarize the compositional clues for the origin of Phobos Currently, the most likely scenario is the in-situ formation of Phobos(re-accretion?), although a capture of achrondrite-like meteorites is not completely ruled out. A more definitive answer to the origin of Phobos will benefit from in-situ measurements, or sample return. The future Russian Phobos-Grunt mission (Phobos Sample Return) will certainly contribute to our understanding regarding the origin of Phobos. The First Moscow Solar System Symposium , 11 – 15 October 2010, Moscow, Russia
Several features in mid-IR spectra… …and VIS/NIR spectra almost featureless? • There are several physical and chemical mechanisms that can act to eliminate or reduce the strength of the 1- and 2-mm bands. • Both the 1- and 2-mm bands arise from electronic transitions of ferrous-bearing minerals such as pyroxene (1- & 2-mm) and/or olivines (1 mm). If the surface materials on Phobos are Fe-free, or Fe-poor, then these spectral features will be absent, or reduced in their intensity. • Mixtures of minerals will have an influence on the observed band depths. Both laboratory and theoretical studies of the reflectance behaviour of opaque materials (metals, amorphous carbon, et cetera) mixed with olivines and pyroxenes show that relatively low abundances of the opaques reduce the 1 and 2 micrometer bands drastically. • Mineraloids such as glasses produced by quenching of materials from the liquid state, or by impact processes exhibit much less pronounced spectral features at VNIR wavelengths because of the lack of well-defined crystalline structure associated with the electronic transitions seen in pyroxenes and olivines. • Many laboratory reflectance spectra of pure fine-grained minerals document the decrease in band depth as the particle size decreases. The First Moscow Solar System Symposium , 11 – 15 October 2010, Moscow, Russia
Several features in mid-IR spectra… …and VIS/NIR spectra almost featureless? At mid-IR wavelengths, both Allende and Elenovka become brighter and almost all of the spectral maxima become more pronouncedafter laser irradiation. This limited comparison of laboratory data suggests that mid-IR spectra appear to be less influenced-degraded by space weathering than VIS/NIR spectra, and perhaps spectral features are enhanced. • Space weathering? • The effects of space weathering include glass and agglutinate formation, comminution, and deposition of fine metallic iron, all due to vapor condensation created via sputtering and/or micrometeorite impacts. • At visible andnear-IR wavelengths, documented effects of space weathering on silicates include darkening, reddening, and reduction of spectral bands. • The effects of space weathering in mid-IR have been studied mainly for the Moon, Mercury, and few asteroids. Salisbury et al. (1997) demonstrated that Lunar space weathering has little or no effect on the Christiansen feature of lunar samples. • We found two samples in the RELAB spectral library that had been exposed to nano-pulsed laser bursts, simulating micrometeorite impacts: Allende and Elenovka • Space weathering has the potential to reduce the VIS/NIR bands, with possibly little or no effect in the mid-IR. The First Moscow Solar System Symposium , 11 – 15 October 2010, Moscow, Russia