Download
1 / 7
70 likes | 79 Views
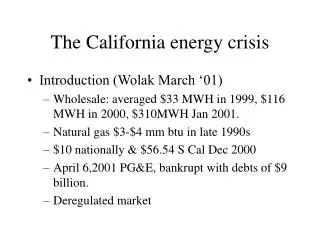
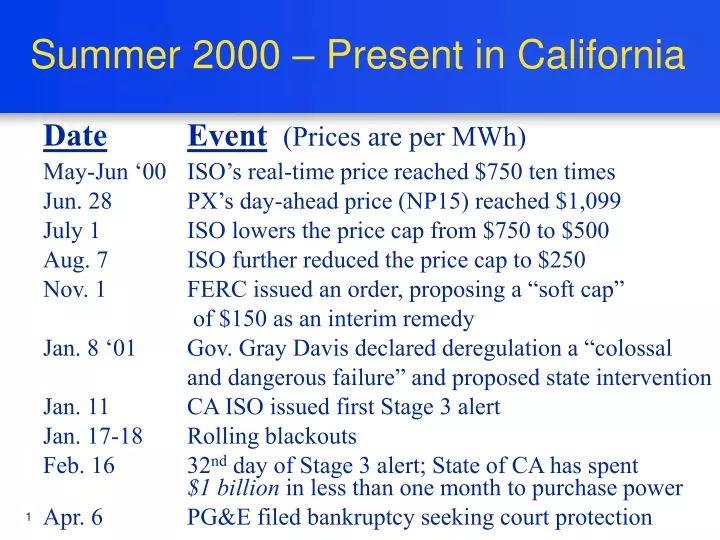
Summer 2000 – Present in California. Date Event (Prices are per MWh) May-Jun ‘00 ISO’s real-time price reached $750 ten times Jun. 28 PX’s day-ahead price (NP15) reached $1,099 July 1 ISO lowers the price cap from $750 to $500 Aug. 7 ISO further reduced the price cap to $250

E N D
Summer 2000 – Present in California DateEvent(Prices are per MWh) May-Jun ‘00 ISO’s real-time price reached $750 ten times Jun. 28 PX’s day-ahead price (NP15) reached $1,099 July 1 ISO lowers the price cap from $750 to $500 Aug. 7 ISO further reduced the price cap to $250 Nov. 1 FERC issued an order, proposing a “soft cap” of $150 as an interim remedy Jan. 8 ‘01 Gov. Gray Davis declared deregulation a “colossal and dangerous failure” and proposed state intervention Jan. 11 CA ISO issued first Stage 3 alert Jan. 17-18 Rolling blackouts Feb. 16 32nd day of Stage 3 alert; State of CA has spent $1 billion in less than one month to purchase power Apr. 6 PG&E filed bankruptcy seeking court protection
Western U.S. Power Markets:Low, Stable Prices until mid 2000 Energy crunch Capacity crunch Calm Source: NyMEX
Natural Gas Transmissionin California Source: EIA
Daily Natural Gas Prices - 2000 $/MMBtu 60.00 50.00 40.00 30.00 Southern California Border 20.00 10.00 Henry Hub 0.00 12/31/1999 02/29/2000 04/30/2000 06/30/2000 08/31/2000 10/31/2000 Natural Gas Spot Prices Source: NG Daily Index
1000 800 600 Original Price $/MWh Adjusted Price 400 200 0 1/1/00 5/1/00 3/1/00 7/1/00 9/1/00 11/1/00 How much does rising gas prices affect electricity prices? NP-15 Prices: “Nominal” and adjusted for natural gas prices. Source: California PX
Prices Exploded Across the West 1999 Power Price 2000 Power Price Mid Col$26.53 137.03 COB $30.66 137.56 NP-15 $35.82 114.05 Four Corners $30.39 114.43 SP-15 $32.69 110.94 CA PX $29.36 91.33 Palo Verde$31.25 114.18 EVA: Power Markets Week, annual averages of day-ahead transactions weekly indices. NP, SP-15 began 3-20-99.