Download
1 / 28
280 likes | 440 Views
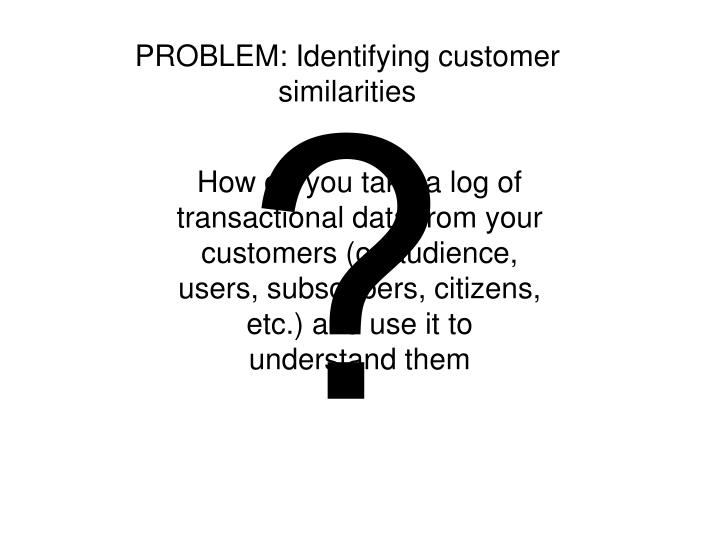
?. PROBLEM: Identifying customer similarities. How do you take a log of transactional data from your customers (or audience, users, subscribers, citizens, etc.) and use it to understand them.

E N D
? • PROBLEM: Identifying customer similarities • How do you take a log of transactional data from your customers (or audience, users, subscribers, citizens, etc.) and use it to understand them
Traditional methods of “blasting” customers with e-mail newsletters in an all-or-nothing send is less and less effective.
But • It’s hard to understand each customer personally, especially if they’ve all had their own different ways of engaging with you.
We need to take the customer base and find a happy medium between blasting everyone with the same e-mail, and understanding everything about everyone for an individualized email newsletter.
One way to find a balance is to use clustering to create a marketsegmentation of customers so that you can market to segments of customers with targeted content, deals, etc.
SOLUTION: Exploratory data mining • Clusteranalysis is the practice of gathering up a bunch of objects and separating them into groups of similar objects.
Clustering techniques help tease out relationships in large datasets that are too hard to identify by eye.
Relationships between customers is useful across industries - whether it’s film recommendations based on the viewing habits of people in a cluster, or identifying crime hot spots in urban areas.
The most common type of clustering is called k-means clustering - the go-to clustering technique for knowledge discovery in databases across industries and governments.
K-means isn’t the most rigorous of techniques, but more often than not it hits the spot. It requires analyst intuition, which is part of its attraction: it’s not an unsupervised machine learning technique.
The goal of k-means clustering is to take some points in space and put them into k groups (where k is any number you want to pick).
The k-groups are defined by a point in the centre that says: “Join me if you are closer to this point than any other.”
Just to be technical, the group centre is called the clustercentroid - the mean from which k-means gets its name. And this creates a Voronoi Diagram, named after, you guessed it, Voronoi. • And
Grade 8 Grad Dance • Grade 8 graduation dance
Song List • Text • Led Zeppelin: Stairway to Heaven • Deep Purple: Smoke on the Water • Alice Cooper: Elected • Queen: Bohemian Rhapsody • Sweet: Ballroom Blitz • Wings: Band on the Run
K-Means Clustering A method of unsupervised machine learning that provides a way to classify a given data set around a certain number of clusters. The most well-known clustering algorithm is the k-means, an iterative expectation-maximization type approach, which attempts to address the following objective: given a set of points in a Euclidean space and a positive integer k (the number of clusters), split the points into k clusters so that the total sum of the (squared Euclidean) distances of each point to its nearest cluster centre is minimized. In our example we are working with customer data obtained through an email marketing campaign. This would work equally well with retail purchase data, ad conversion data, social media data, and so on.
Goal • Segment the list of customer into groups based on their • interest in specific wine offerings. Then, you could • customize the newsletter to each segment and maybe • drum up some more business. • Which ever deal you thought matched up better with the • segment could go in the subject line and would come first • in the newsletter. That type of targeting can result in a • bump in sales.
Method 1. Look at what data we have. OrderInformation: Worksheet of wine deals last year (32). Transactions: Worksheet of which customer bought what deals (324 purchases).
2. • Determine what to measure • Pivot table from transaction tab: Offers (row), Customers (column),Count of Customers (values). • This gives us purchases by customer in matrix form. We know what deal each customer took, and what they didn’t take.
3. • Consolidate results (standardize data) • Copy orderInformation tab and name new tab: Matrix • Then paste the values from the Pivot table starting at column H • End up with a fleshed out version of the matrix with consolidated deal descriptions with purchase data.
4. • Determine number of clusters (k) • Copy MATRIXtab and name new tab: 4MC Insert four columns after Past Peak in columns Hthrough K that will be the cluster centers.Label these clusters Cluster 1 through Cluster 4. You can also place some conditional formatting on them so that whenever each cluster center is set you can see how they differ. What you’d like to see is that they, like in the middle school dance, distribute themselves to minimize the distances between each customer and their closest cluster center. Obviously then, these centers will have values between 0 and 1 for each deal since all the customer vectors are binary.
5a. • Measuring distances between customers and deals: Euclidean Distance These two points are 8 – 4 = 4 feet apart in the vertical direction. They’re 4 – 2 = 2 feet apart in the horizontal direction. By the Pythagorean theorem then, the squared distance between these two points is 4^2 + 2^2 = 16 + 4 = 20 feet. So the distance between them is the square root of 20, which is approximately 4.47 feet Euclidean distance is the square root of the sum of squared distances in each single direction
5b. • Measuring distances between customers and deals: Euclidean Distance In the context of the newsletter subscribers, you have more than two dimensions, but the same concept applies. Distance between a customer and a cluster center is calculated by taking the difference between the two points for each deal, squaring them, summing them up, and taking the square root. Starting in cell L34, below Adams’ purchases, you can take the difference of Adams’ vector and the cluster center, square it, sum it, and square root the sum, using the following array formula (note the absolute references that allow you to drag this formula to the right or down without the cluster center reference changing): {=SQRT(SUM((L$2:L$33-$H$2:$H$33)^2))} {=SQRT(SUM((L$2:L$33-$I$2:$I$33)^2))} {=SQRT(SUM((L$2:L$33-$J$2:$J$33)^2))} {=SQRT(SUM((L$2:L$33-$K$2:$K$33)^2))} The end resultis a single number: 1.732.This makes sense because Adams took three deals, but the initial cluster center is all 0s, and the square root of 3 is 1.732.
5c. • Measuring distances between customers and deals: Euclidean Distance For each customer then, you know their distance to all four cluster centers. Their cluster assignment is to the nearest one, which you can calculate in two steps. Going back to customer Adams in column L, let’s calculate the minimum distance to a cluster center in cell L38. That’s just: =MIN(L34:L37) And then to determine which cluster center matches that minimum distance, you can use the MATCH formula: =MATCH(L38,L34:L37,0) Labels for cells G34 – G39: Distance to Cluster 1 Distance to Cluster 2 Distance to Cluster 3 Distance to Cluster 4 MinimumCluster Distance Assigned Cluster
6. • Solving for Cluster Distances You now have distance calculations and cluster assignments in the spreadsheet. To set the cluster centers to their best locations, you need to find the values in columns H through K that minimize the total distance between the customers and their assigned clusters denoted on row 39 beneath each customer. This is an optimization step, and an optimization step means using Solver. In order to use Solver, you need an objective cell, so in cell A36, let’s sum up all the distances between customers and their cluster assignments: =SUM(L38:DG38)
7a. • Running Solver This sum of customers’ distances from their closest cluster center is exactly the objective function encountered earlier when clustering on the McAcne Middle School dancefloor. But Euclidean distance with its squares and square roots is crazy non-linear, so you need to use the evolutionary solving method instead of the simplex method to set the cluster centers. You have everything you need to set up a problem in Solver: • Objective: Minimize the total distances of customers from their cluster centers (A36). • Decision variables: The deal values of each row within the cluster center (H2:K33). • Constraints: Cluster centers should have values somewhere between 0 and 1. (H2:K33 <= 1)
7b. • Solution Method The Simplex LP engine solves linear optimization problems. Alinear optimization problem is one in which the target cell and constraints are all created by adding terms of the (changing cell)*(constant) form. The GRG nonlinear engine solves optimization problems in which the target cell or some of the constraints are not linear and are computed by using common mathematical operations such as multiplying or dividing changing cells, raising changing cells to a power, exponential or trigonometric functions involving changing cells, and so on. The GRG engine includes a powerful Multistart option that enables you to solve many problems that were solved incorrectly with previous versions of Excel. The Evolutionary Solver engine is used when your target cell or constraints contain non- smooth functions that reference changing cells. A nonsmooth function is one whose slope abruptly changes. For example, when x = 0, the slope of the absolute value of x abruptly changes from –1 to 1. If your target cell or constraints contain IF, SUMIF, COUNTIF, SUMIFS, COUNTIFS, AVERAGEIF, AVERAGEIFS, ABS, MAX, or MIN functions that reference the changing cells, you are using nonsmooth functions, and the Evolutionary Solver engine probably has the best shot at finding a good solution to your optimization problem.
8. • Interpreting the results Once Solver gives you the optimal cluster centers, you get to mine the groups for insight!