Download
1 / 34
370 likes | 719 Views
Estimating Clustering Coefficients and Size of Social Networks via Random Walk. *Research was conducted while the author was unaffiliated. Motivation: Social Networks. Qzone. Habbo. Netlog. Sonico.com. Bebo. Renren. Google+. Twitter. Flixster. Facebook. Classmates.com. MyLife.

E N D
Estimating Clustering Coefficients and Size of Social Networks via Random Walk *Research was conducted while the author was unaffiliated
Motivation: Social Networks Qzone Habbo Netlog Sonico.com Bebo Renren Google+ Twitter Flixster Facebook Classmates.com MyLife Tagged hi5 SinaWeibo Orkut Friendster Plaxo Vkontakte LinkedIn
Motivation: External access The online social network Social Analytics v3 v5 v7 v1 v2 v9 Privacy v4 v6 v8 Disk Space Communication
Task: Estimate parameters Network Average CC Global Clustering Coefficient Number of Registered Users Predicting Social Products’ Potential. Business development/advertisement/market size.
Global Clustering Coefficient Global CC = v3 v5 v7 v1 v2 v9 Triangle Connected Triplet v4 v6 v8
Global Clustering Coefficient Exact: [Alonet al, 1997] Estimation – input is read at least once: • Random Access: [Avron, 2010] • Streaming Model: [Buriolet al, 2006] Estimation – sampling: • Random Access: [Schanket al, 2005] • External Access: This work.
Local Clustering Coefficient Ci= di – degree of node i C2 = v3 v5 v7 d1 = 1 d2 = 3 d9 = 2 v1 v2 v9 Network Average CC = average local CC v4 v6 v8
Network Average CC Exact: Naïve. Estimation – input is read at least once: • Streaming Model: [Becchetti et al, 2010] Estimation – sampling: • Random Access: [Schanket al, 2005] • External Access: [Ribeiroet al 2010], [Gjokaet al, 2010], This work – Improved accuracy.
Number of Registered Users Exact: trivial Estimation – sampling: • External Access: [Hardiman et al 2009], [Katzir et al, 2011],This work – Improved accuracy.
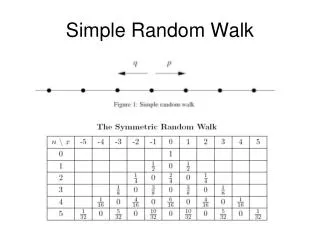
Random Walk v1 v2 v3 v4 v5 Sampled Nodes: Stationary Distribution = v3 v5 v7 v1 v2 v9 v4 v6 v8
Random Walk - Summary Sampled Nodes Visible Nodes Invisible Nodes Visible Edges v3 v5 v7 Invisible Edges v1 v2 v9 v4 v6 v8
Global CC Algorithm The estimated global clustering coefficient: • – Sampled nodes average degree - 1. 2. – Sampled nodes average
Global CC Example v3 v5 v7 v1 v2 v4 v6
Expectation of Total expectation combinations.2 yield =1 – The degree of node vi. – The number of triangles contain vi. – The number of nodes.
Global CC Proof – The degree of node vi. – The number of triangles contain vi. – The number of nodes.
Guarantees For any and , we have when the number of samples, r, satisfies
Network Average CC Algorithm The estimated network average CC: • – Sampled nodes average 1/degree . 2. – Sampled nodes average
Evaluations DBLP facts: Paper with most co-authors: has 119 listed authors.Most prolific author: Vincent Poor with 798 entries.
Global CC Relative improvement ranges between 300% and 500% depending on the network.
Network Average CC Relative improvement ranges between 50% and 400% depending on the network.
Conclusions • New external access estimator from Global Clustering Coefficient. • Improved estimator for Network Average Clustering Coefficient. • Improved estimator for number of registered users.
The Birthday “Paradox” The expected number of collisions in a list of r i.i.d. samples from a set of n elements is A collision is a pair of identical samples. Example: Samples: X = (d, b, b, a, b, e).Total 3 collisions, (x2, x3), (x2, x5), and (x3, x5)
Cardinality estimation uniform Needs samples to converge.Used by [Ye et al, 2010] to estimate the size. When C collisions are observed
Stationary distribution sampling v5 v2 v5 v4 v2 Sampled Nodes: Stationary Distribution = v3 v5 v7 v1 v2 v9 v4 v6 v8
Cardinality estimation stationary Needs samples to converge when . When C collisions are observed
Example: v5 v2 v5 v4 v2 v3 v5 v7 v1 v2 v9 v4 v6 v8
Global CC Proof – The degree of node vi. – The number of nodes.
Improvements • Using all samples (Hardiman et al 2009). • Using Conditional Monte Carlo (This work).
All Samples Restrict computation to indexes m steps apart, A collision is only be considered within . Ratio of degrees is similarly defined
Conditional Monte Carlo A collision between and , is replaced by the conditional collision is steps k+1 and l+1 respectively.
Conditional Monte Carlo • The pair is not a collision, but it contributes to the collision counter. v3 v5 v7 v1 v2 v9 v4 v6 v8