Download

1 / 12
120 likes | 257 Views
THE POISSON RANDOM VARIABLE. POISSON DISTRIBUTION ASSUMPTIONS. Can be used to model situations where: No two events occur simultaneously The probabilities for the number of events that will occur in intervals of the same length are the same

E N D
THE POISSON RANDOM VARIABLE
POISSON DISTRIBUTIONASSUMPTIONS • Can be used to model situations where: • No two events occur simultaneously • The probabilities for the number of events that will occur in intervals of the same length are the same • The time until the next event occurs is independent of when the last event occurred • The Poisson distribution can be completely characterized by knowing only the average number of events that occur in the interval = μ
POISSON DISTRIBUTIONMean, Variance, Standard Deviation • If μ is the average number of events that will occur in the time interval, then • Mean = μ • Variance = μ • STD DEV = SQRT(μ)
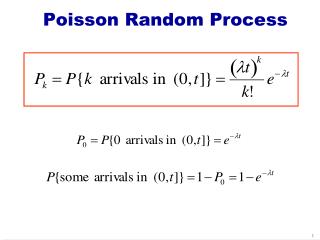
POISSON PROBABILITY DISTRIBUTION • Prob (x events in the time interval) = f(x)
Adjusting μ • Suppose the average number arrivals in an hour is 15, but we wish to know the probability of the number of arrivals in 20 minutes • For 60 minutes, μ = 15. • For 20 minutes, μ = (20/60)15 = 5
EXAMPLE • Customers arrive to a bank on the average of once every 4 minutes • What is the mean and standard deviation of the number of arrivals in • 1 hour? • = 60/4 = 15 so Std. Dev. = SQRT(15) = 3.873 • 20 minutes? • = 20/4 = 5 so Std. Dev. = SQRT(5) = 2.236
Calculating a Point Probability • What is the probability that there will be exactly 9 arrivals in one hour to the bank?
POISSON PROBABILITIESUSING EXCEL • Mean number of events in the interval = μ • Point Probability P(EXACTLY x events in the interval) = POISSON(x, μ,FALSE) • Cumulative Probability P(x or less events in the interval) =POISSON(x, μ,TRUE)
P(X = 2) = =POISSON(2,5,FALSE) P(X <= 6) = =POISSON(6,5,TRUE) Point and Cumulative Probabilities for the Poisson Distribution with μ = 5
Example In a given hour, the average number of arrivals, μ= 15 • What is the probability that in a 20 minute period there will be: • 6 or less arrivals • between 5 and 8 arrivals • 8 or more arrivals • Exactly 4 arrivals • Note for 20 minutes, μ= 5
“Less Than or Equal”Prob. =POISSON(6,5,True) “Greater Than or Equal to” Prob =1–POISSON(7,5,TRUE) “Between” Prob. =POISSON(8,5,TRUE)- POISSON(4,5,TRUE) “Equal To” Prob. =POISSON(4,5,FALSE) Typical Poisson Probabilities
REVIEW • Poisson Random Variable • Definition • Mean, Variance • Point Probabilities • From Formula • By Excel • Cumulative Probabilities • By Excel