Download
1 / 32
320 likes | 399 Views
Proposed Accountability Index. Pete Bylsma, EdD, MPA Consultant to the State Board of Education February 25, 2009 http://www.sbe.wa.gov/spa.htm bylsmapj@comcast.net. Overview of Presentation. Rationale for creating a new system Guiding principles AYP vs. new system

E N D
Proposed Accountability Index Pete Bylsma, EdD, MPA Consultant to the State Board of Education February 25, 2009 http://www.sbe.wa.gov/spa.htm bylsmapj@comcast.net
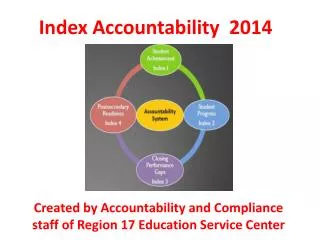
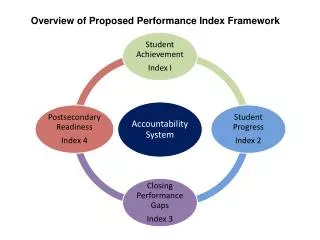
Overview of Presentation • Rationale for creating a new system • Guiding principles • AYP vs. new system • Process used to develop the proposed system • Proposed indicators and outcomes • Ratings and tier assignments • School and district results for 2007 • Handling special cases • Recognition categories and criteria • Identifying “Priority” schools and districts • Next steps
Why a state accountability system? • Legislative mandate for the SBE to “adopt objective, systematic criteria” for successful schools and districts and for those in need of assistance • Accountability is the “3rd leg” of a comprehensive state education system after establishing standards and assessments • Federal accountability system (AYP) is viewed as unfair, too complicated, and punitive • State provides most of the education funding • Supports legislative efforts to revise funding system
Guiding Principles • Be fair, reasonable, and consistent • Be transparent and simple to understand • Be valid and accurate • Use existing data • Rely on multiple measures • Include state assessment results from all grades and subjects • Apply to as many schools & districts as possible • Provide multiple ways to show success and earn recognition • Rely mainly on criterion-referenced measures • Use familiar concepts • Use concepts of AYP when appropriate • Be flexible enough to accommodate future changes
Role of AYP • Widespread belief that AYP is overly complex, less inclusive, too narrow, not transparent, and not valid for identifying success or most in need • Recommend using disaggregated results to help determine which schools and districts need the most help (“Priority” designation) • Will submit proposal to US Ed. Dept. to use this system to determine AYP
Advantages of Proposed System • More valid Uses performance of all students in more subjects, more differentiated than a “Yes/No” system, does not count students multiple times, looks at improvement and how the outcomes compare with similar schools • More inclusive/comprehensive Uses a smaller minimum N (10 students across the entire school/district), includes the results of all students (regardless of how long they have been enrolled), includes both writing and science (this helps prevent a narrowing of the curriculum), uses Learning Index to measures performance across the range of assessment results (reduces the focus on bubble kids) • Less volatile over time Assessment results are combined across all grades (not individual grades) so the N is larger and the students being assessed do not change much from year to year • More transparent Does not include a margin of error, benchmarks are the same over time and among the different subjects, fewer subgroups and rules, schools and districts are evaluated using the same criteria, N is the same for all groups and both schools and districts The results will provide recognition and will identify fewer schools and districts in the lowest tier because improvement will occur
Process to Date • Initial proposal reviewed by an advisory panel • Convened diverse set of advisors to provide input on technical details for a revised proposal • Applied proposed rules to data to ensure validity, made adjustments to increase precision • Ongoing feedback received from OSPI and others • Presentations and feedback at SBE meetings and ESDs • Further refinements taking place
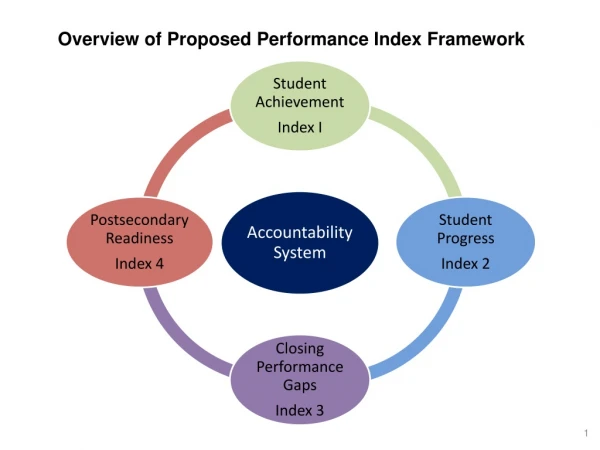
Proposed Outcomes/Indicators Five Outcomes Results from 4 assessments (reading, writing, math, science) aggregated together from all grades Extended graduation rate for all students Four Indicators • Achievementby non-low income students (% meeting standard/ext. grad rate) • Achievement by low income students (eligible for FRL) • Achievement vs. Peers (Learning Index and ext. grad rate controlling for ELL, low-income, special ed., gifted, mobility) • Improvement (change in Learning Index from previous year) Creates a 5x4 matrix with 20 outcomes
Outcome/Indicator Benchmarks & Ratings
Outcome/Indicator Benchmarks & Ratings
Achievement vs. Peers • Considers contextual differences • Makes “apples to apples” comparisons by controlling for level of ELL, low-income, special education, mobile, & gifted students (+ funding level in district analysis) • Currently no data generated on this type of indicator • Others have done this type of analysis • Seattle Times school guides • Simple scatterplots with trend lines (only one variable at a time) • Other states using this concept in accountability systems • Complexity presents a communications challenge
Illustration of Ach. vs. Peers A 7 B 4 1
Tier Names and Ranges Assigned to a “tier” based on index score
School and District Results (2007) 228 schools were in the Struggling tier with 74,000 students (1 in every 14 students); 98 were alternative schools or served other special populations.Over 2-year period, 7.5% of all schools averaged < 2.50 (Struggling tier) 17 districts were in the struggling tier in 2007 (average 1,000 students)
Key Changes Made or Proposed • Slow down implementation schedule • Avoid double-counting students by creating separate ratings for low income and non-low income students • Move to a 7-point scale, add another tier • Exclude results for ELL students in first 3 years or until reaching Level 3 on WLPT (whichever comes 1st) • Think of other ways to hold alternative school accountable • Exclude improvement indicator for those with very high performance • Simplify recognition system
District Accountability • Uses the same indicators, outcomes, benchmarks, ratings, recognition system as schools • Combines all the grades together(no separate results for each grade band) • N is 10 for entire district (very few left out) • Control for funding level for “peer” analysis
Special Case #1 – ELL Exemption • Propose exempting ELL results in the first 3 years of enrollment or until advanced proficiency achieved on the WLPT (whichever comes first) • Results currently count in AYP in 2nd year of enrollment • Research found it usually takes at least 3 years to achieve “academic” proficiency in English • OSPI requested this policy but was denied; WA could still use this policy when calculating the index • ELLs would still take the test in their 2nd year, WLPT results would be made public to increase accountability • Would not affect many students (most ELLs in tested grades have been in US for 3 years or have achieved intermediate proficiency); would have a small positive impact on index where there are many ELLs present
Special Case #2 – Alternative Schools • Propose using other means for holding alternative schools accountable • Many different types exist in the state, so no “peer” indicator computed for schools with this designation • Represent < 4% of enrollment but many serve students facing significant challenges, generating low index score (More than half the “schools” serve at-risk students in 9-12) • Many need to be held accountable through more than index • Two Options Being Considered • 1: Use regular process, use in-depth analysis to determine if school is using best practices, showing progress, and their role/status/resource level within the district • 2: Allow schools serving high-risk/special populations to use additional measures to determine their tier (e.g., credits earned, attendance, gains on pre-post tests)
Special Case #3Improvement by High Performers • Propose excluding improvement indicator when reaching very high achievement levels • Improvement is difficult when achievement is very high • Cannot receive the highest rating (7) after the Learning Index reaches 3.85/4.00 and when the graduation rate reaches 94% • Would go into effect when achievement is in the top range two years in a row, making it impossible to receive the maximum rating in the second year • No school or district has yet to met these criteria for the assessments; 11% met these criteria for graduation rate • School/district could decide to include the results
Recognition System • Guiding principles • Multiple ways to demonstrate success, earn recognition • Criterion-based system Theory of Change: People are motivated more by successthan guilt or blame; need clear, challenging, attainable goals • Use same accountability matrix, receive recognition when meeting specific benchmarks • Based on 2-year average
Suggested Cells and Criteria Recognize results in 20 cells + Index (21 total) * Minimum 2-year average rating to earn recognition
Complement Existing Recognition Federal recognition (competitive) • Blue Ribbon Schools • Academic Achievement Award • Distinguished Schools Award • Title I Improvement Award OSPI recognition • Schools of Distinction (top 5%) • Improvement Award (schools and districts) No recognition exists yet based on meeting achievement levels or “beating the odds”
Current Recognition Note: Improvement is measured in different ways.
Identifying Priority Schools • Those in “Struggling” tier undergo deeper analysis to determine which need more help • Many issues to examine: • Contextual issues • In-depth analysis of disaggregated WASL/WAAS • AYP results • Other data • Identification process similar to that used now by OSPI
Issues to be Resolved • Determine how a school/district “makes AYP” • How to include other outcome measures for HS • Continue receiving input from stakeholders • - Includes review by OSPI’s external panel of advisors • Collaborate with OSPI • - Develop proposal to US Education Dept. to use the index for federal accountability purposes • - Create options for showing results on Report Card • - Determine how index results relate to recognition/state assistance • Identify ways to show “reciprocal” accountability • Timing of implementation