Download
1 / 19
190 likes | 326 Views
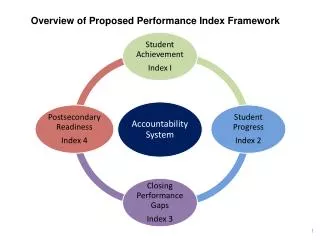
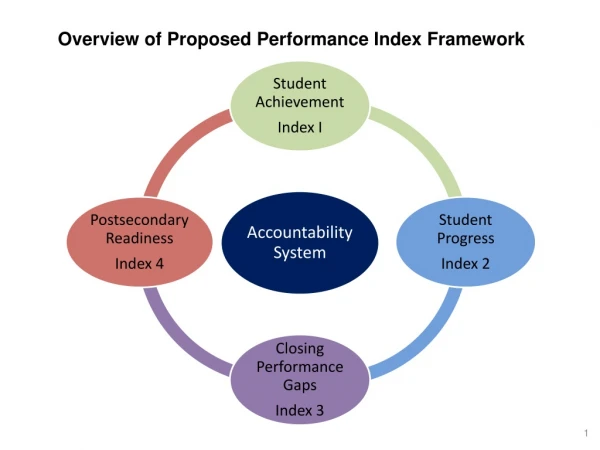
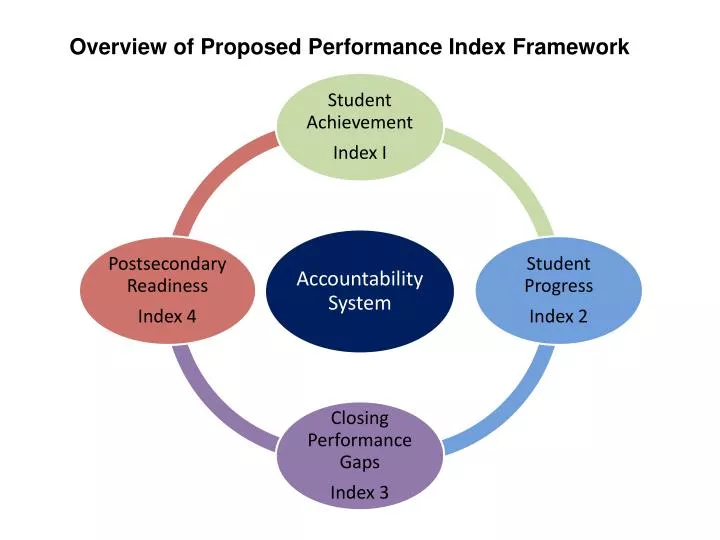
Overview of Proposed Performance Index Framework. STAAR Satisfactory Performance (2013 and beyond) All Students Only (No minimum size) Combined over All Subject Areas Percent met Phase-In Level II standard on: STAAR Grades 3-8 English and Spanish

E N D
STAAR Satisfactory Performance (2013 and beyond) • All Students Only (No minimum size) • Combined over All Subject Areas Percent met Phase-In Level II standard on: • STAAR Grades 3-8 English and Spanish • EOC spring and the previous fall and summer • STAAR Grades 3-8 and EOC Modified and Alternative • TAKS included in 2013 only: Grade 11 results at Met Standard performance standard English Language Learners (ELL) • Students in 1st through 3rd year in US are EXCLUDED • Asylee/Refugee students in years 1-5 are Excluded Index 1: Student Achievement NOTE: ALL ELL STUDENTS MUST TEST EVEN THOSE NOT INCLUDED IN ACCOUNTABILITY. SAISD R&E
Retest Results • Grade 5 and 8, best result 1st and 2nd administration • EOC first administration only Students below Grade 9 taking EOC courses • Administrative rules for the assessment program will require that students be administered the EOC test rather than the STAAR grade level assessment for the subject Cap • The 1% (Alternate) and 2% (Modified) caps are included as system safeguards, but will not apply to performance. Accountability Subset • Grades 3-8 and EOC (fall & spring): fall enrollment snapshot date • EOC tests administered summer: prior year fall snapshot date (ex. 2013 EOC accountability= Summer 2012, Fall 2012, Spring 2013) Index 1: Student Achievement SAISD R&E
Methodology Results are summed across tests, grades, and subjects;Number meeting the phase-in 1 Level II standard divided by the number of assessments #passed Reading+#passed Writing+#passed Math+#passed Science+#passed Social Studies #tested Reading+#tested Writing+#tested Math+#Tested Science+#tested Social Studies Campus Example: 2012 Sample Accountability Results Index 1: Student Achievement SAISD R&E
Progress toward Satisfactory or Advanced Levels (Now used in 2013, cut scores and standards to be set after testing) Subjects/Grades • Reading, Writing, & Math • Grades 4-8 and EOC English Language Learners • Year 1-3 excluded • Asylees/refugees Year 1-5 excluded Retests Included • Grades 5 & 8 – both primary administrations • EOC first administration only Ten Student Groups Evaluated • All Students • Special Education Students • English Language Learners (ELLs) Race/Ethnicity • African American • American Indian • Asian • Hispanic • Pacific Islander • White • Two or More Races Minimum size • All Students: None • Race/ethnicity, ELL, and SPED: >=25 Index 2: Student Progress SAISD R&E
Current Year Vertical Scale Scores • Each grade level and subject will have an expected growth amount using the vertical scale scores. • Reading, Math, and Writing will be used. • Only students with data for both years will be included in the analysis. • Students identified as Maintained will be credited with one point for performance while students identified as Exceeded will get two points. Index 2: Student Progress SAISD R&E
Methodology Results are summed across tests and grades, by subject and student group, number in the student group that meet the growth standard for that subject divided by the number in the student group with a growth measure for the subject. Number In Group That Met Growth Standard For Subject Number in Student Group With a Growth Measure for Subject Campus Example: Reading Index 2: Student Progress SAISD R&E
Methodology Weighted growth rates are summed across grades for each subject and student group. The total points for each group are added and divided by 200 times the number of groups with more than 25 students to get the index 2 score. Campus Example Index 2: Student Progress SAISD R&E
Achievement Gaps Measured for Satisfactory (2013)and Advanced Performance Levels (2014) • Groups Evaluated: All Economically Disadvantaged Students and • The two lowest performing race/ethnicity groups IF three or more meet minimum size • The one lowest performing race/ethnicity group IF only two groups meet minimum size • No other group IF only one race/ethnicity group meets minimum size English Language Learners • Year 1-3 excluded • Asylees/refugees Year 1-5 excluded Retests Included (best results) • 5 and 8 1st and 2nd administrations • EOC Summer, Fall and Spring Subjects and Accountability Subset • Same as Index 1 Minimum size • Economically Disadvantaged: None • Race/ethnicity>=25 Index 3: Closing Performance Gaps SAISD R&E
Methodology Percent of students at the specified student performance level is multiplied by the weight for that performance level • 2013: One point credit given for each percentage of students at the phase-in Level II performance standard • 2014: Two point credit given for each percentage of students at the Level III performance standard (2014 and beyond) Campus Example for Reading (Only one Race/Ethnicity Meets Min Size) Index 3: Closing Performance Gaps SAISD R&E
Overall points for Index 3. Index 3: Closing Performance Gaps SAISD R&E
Measures of Postsecondary Readiness Credit based on average of two postsecondary indicators: 1) STAAR final Level IIfor Grades 3 – 8 and EOC (2014 and beyond) and 2) High school Graduation rate and Recommended/Advanced Diploma Plan Graduates Index 4: Postsecondary Readiness Index 4 will not apply to Elementary or Middle School campuses in 2013. SAISD R&E
STAAR Final Level II(2014 and beyond) English Language Learners Excluded • Year 1-3 • Asylees/refugees Year 1-5 Retests Results • Grade 5 and 8, best result 1st and 2nd administration • EOC first administration only Eight Student Groups Evaluated • All Students Race/Ethnicity • African American • American Indian • Asian • Hispanic • Pacific Islander • White • Two or More Races Minimum size • All Students: None • Race/ethnicity >=25 Subjects/Grades/Acc. Subset • Same as Index 1 Number of Students Met Final Level II Standard on One or More Tests Number of Students with One or More Tests Index 4: Postsecondary Readiness SAISD R&E
Grades 9-12 Graduation Rate (2013 and beyond) English Language Learners • Defined as students who were ever identified as LEP since entering Grade 9 in Texas public schools Best of the 4 or 5-year Graduation Rate will be Used For 2013: • Class of 2012 = 4-year Grad Rate • Class of 2011 = 5-year Grad Rate Grade 9-12 Annual Dropout Rate • Used if a district/campus has Grades 9, 10, 11, or 12 but does not have a 4-year graduation rate All Ten Student Groups Evaluated • Same as Index 2 Minimum size • All Students: None • Race/ethnicity >=25 Graduation Definition: State definition with 5 required exclusions • previous dropouts • ADA ineligible students • Court-ordered GED • Incarcerated adults not served • Refugees and asylees Graduates Graduates + Continuers + GED + Dropouts Index 4: Postsecondary Readiness SAISD R&E
Recommended/Advanced High School Program (2013 and beyond) Eight Student Groups Evaluated • All Students and seven race/ethnicity groups Minimum size • All Students: None • Race/ethnicity >=25 For 2013: • Class of 2012 4-year Graduates • Percent coded as having a recommended or advanced diploma Number of graduates with graduation codes for RHSP or AHSP Number of Graduates Index 4: Postsecondary Readiness SAISD R&E
Construction of Index 4 Campus Example Index 4: Postsecondary Readiness SAISD R&E
Index 1: Student Achievement Index 2: Student Progress Index 3: Closing Performance Gaps Index 4: Postsecondary Readiness 82 58 52 Overview of Proposed Performance Index Framework (Sample Campus) 50 SAISD R&E
State Accountability Ratings and Distinctions in 2013 SAISD R&E
2013 Performance Index for Accountability Elementary and Middle Schools • Index 1 • All Students • Index 2 (possible) • All Students • Race/Ethnic Groups • English Language Learners • Special Education • Index 3 • Economically Disadvantaged and two lowest sub-pops (if applicable) High Schools • Index 1 • All Students • Index 2 (possible) • All Students • Race/Ethnic Groups • English Language Learners • Special Education • Index 3 • Economically Disadvantaged and two lowest sub-pops (if applicable) • Index 4 • Graduation Rate • Recommended/Advanced Diplomas SAISD R&E