Download
1 / 25
250 likes | 263 Views
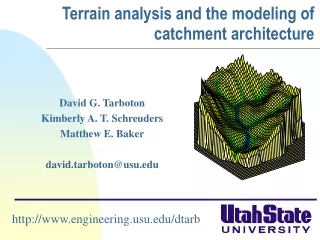
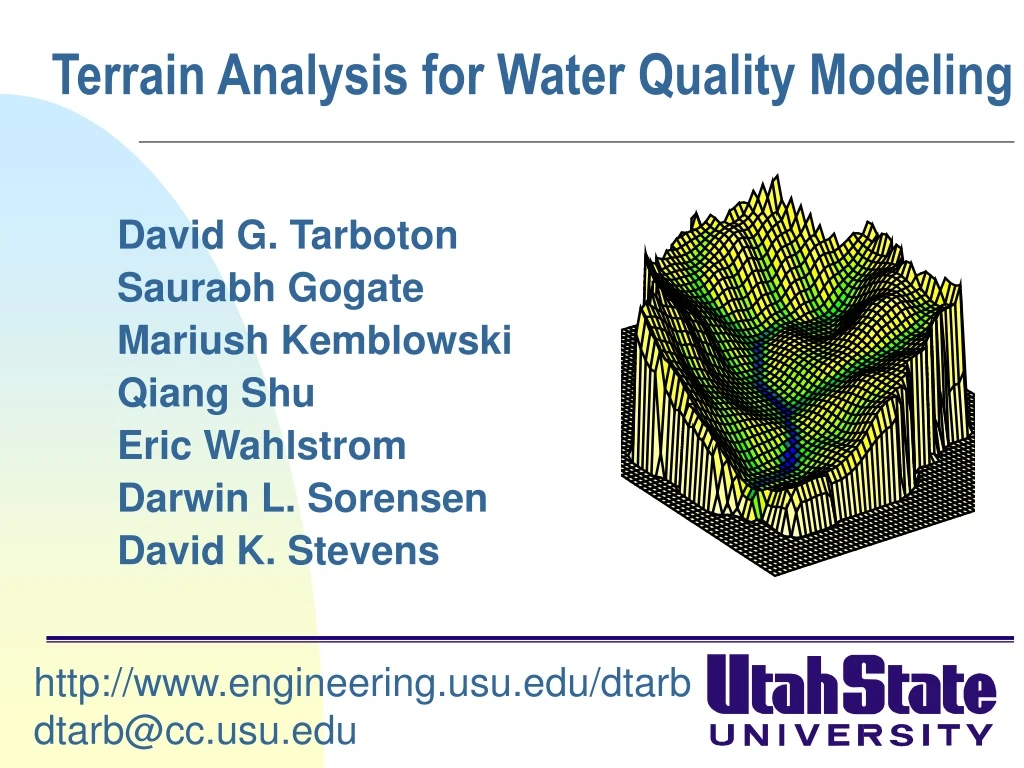
Terrain Analysis for Water Quality Modeling. David G. Tarboton Saurabh Gogate Mariush Kemblowski Qiang Shu Eric Wahlstrom Darwin L. Sorensen David K. Stevens. http://www.engineering.usu.edu/dtarb dtarb@cc.usu.edu. Objectives.

E N D
Terrain Analysis for Water Quality Modeling David G. Tarboton Saurabh Gogate Mariush Kemblowski Qiang Shu Eric Wahlstrom Darwin L. Sorensen David K. Stevens http://www.engineering.usu.edu/dtarb dtarb@cc.usu.edu
Objectives • Incorporate GIS Methodology into the Source Water Protection and Pollution Assessment Process to provide information about potential contamination risks to drinking water supplies • Exploratory low data requirement assessment system for initial screening
Overview • The source water protection problem • Topographically driven screening model methodology • Representing the terrain flow field • TauDEM water quality functions
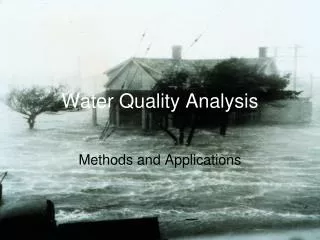
The Need: Source Water Protection • Identify and Inventory potential sources of contamination • Visualize the locations of potential pollution sources and pathways that pollutants may follow • Exploratory modeling to assess pollution susceptibility for prioritization of analysis • Detailed analysis and risk assessment
Assumptions for GIS Topography driven approach • Surface water and its associated contaminants move in directions following the topography. • Shallow subsurface flow follows topography and sustains baseflow. • Surface flows occur over a fraction of the time. Approximated as steady state. • Discharge separated into stormflow and baseflow assumed to represent surface and subsurface flow paths respectively. • Quantity of runoff generated from each grid cell proportional to annual rainfall.
Methodology Stormflow/baseflow separation using HYSEP f = surface runoff time fraction
Runoff proportional to PRISM annual rainfall (inches) Runoff coefficients Steady state water inputs Subsurface Surface - average when active
? Topographically driven flow path assumption Limitation imposed by 8 grid directions.
D Multiple flow direction model Proportion flowing to neighboring grid cell 2 is 1/(1 + 2) Proportion flowing to neighboring grid cell 1 is 2/(1 + 2) Tarboton, D. G., (1997), "A New Method for the Determination of Flow Directions and Contributing Areas in Grid Digital Elevation Models," Water Resources Research, 33(2): 309-319.) (http://www.engineering.usu.edu/dtarb/tarpubs.htm)
Contributing Area using D Contributing Area using D8
Inventory of potential contamination sources such as landuse designated industrial
Conservative compound in surface runoff example Surface runoff Industrial area potential contamination source Contaminant load Contaminant concentration
Surface runoff Contaminant load Contaminant concentration
Useful for example to track where sediment or contaminant moves
Useful for example to track where a contaminant may come from
Useful for a tracking contaminant or compound subject to decay or attenuation
Useful for a tracking a contaminant released or partitioned to flow at a fixed threshold concentration
TauDEM Software Architecture ESRI ArcGIS Toolbar VB GUI application Standalone command line applications C++ COM DLL interface Available from TauDEM C++ library Fortran (legacy) components http://www.engineering.usu.edu/dtarb/ gridio C++ library shapelib C++ library ESRI grid API (Spatial analyst) Vector shape files ASCII text grid Binary direct access grid ESRI binary grid Data formats
TauDEM Software Functionality • Pit removal • Flow directions and slope • Drainage area (D8 and D) • Network and watershed delineation • Threshold/drainage density selection by stream drop analysis (Tarboton et al., 1991, Hyd. Proc. 5(1):81) • Water Quality Functions: • Down slope Influence • Upslope Dependence • Concentration Limited Accumulation • Transport limited accumulation • Decaying Accumulation
Conclusions • Take advantage of GIS Extendibility • Inventory and Integrate potential contaminant information from multiple sources • Exploratory screening model based upon simple assumptions facilitates visualization of potential pollution based upon readily available data for prioritization and further analysis