Download
1 / 44
440 likes | 447 Views
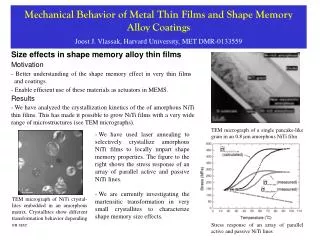
Introduction to nanocomposite thin film coatings Witold Gulbiński. Nanomaterials….. What are they? - bulk materials or thin films with the grain (crystallite) size below 100nm What makes them unique?

E N D
Introduction to nanocomposite thin film coatings Witold Gulbiński
Nanomaterials….. What are they? - bulk materials or thin films with the grain (crystallite) size below 100nm What makes them unique? - their properties (mechanical, electrical, magnetic, optical) strongly differ from macrocystalline materials What are some applications? - hard, wear resistant and low friction coatings, dielectics, magnetic devices
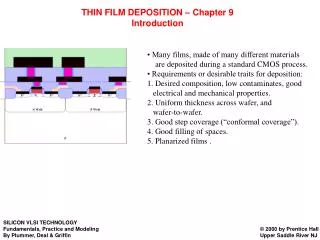
How to measure the grain/crystallite size? • TEM, AFM, STM • X-ray diffraction line broadening analysis • By analyzingthis broadening it is possible to extract information • about the microstructure of a material. • Sources of Line Broadening • Instrumental Broadening • Crystallite Size Broadening • Strain Broadening • Methods of Analysis • Simplified Integral Breadth Methods • Fourier Methods http://fusedweb.pppl.gov/CPEP
Sources of Line Broadening • Instrumental Broadening • Non ideal optics • Wavelength Dispersion • Axial Divergence od the X-ray beam • Detector resolution • Finite Crystallite Size • Extended Defects Extended Defects • Stacking Faults • Lattice Strain (microstrain)
Typical instrumental broadening FWHM – Full Width at Half Maximum of the peak
Peak broadening - Finite Crystallite Size • A perfect crystal would extend in all directions to infinity,so we can say that no crystal is perfect due to it’s finitesize. • This deviation from perfect crystallinity leads to abroadening of the diffraction peaks. • However, above a certain size (~0.1 - 1 micron) this type of broadening isnegligible. • Crystallite size is a measure of the size of a coherentlydiffracting domain. Due to the presence of polycrystallineaggregates crystallite size is not generally the samething as particle size.
Finite Crystallite Size • Line broadening analysis is most accurate when the broadening due to crystallite size effects isat least twice the contribution due to instrumental broadening. • We could also estimate a rough upper limit for • reasonable accuracy by looking at the crystallite size that • lead to broadening equal to the instrumental broadening.
Crystallite size measurement accuracy Conventionaldiffractometer (FWHM ~ 0.10° at 20° 2θ) Accurate Size Range < 45 nm Rough Upper Limit = 90nm Monochromatic Lab X-ray (Cu Kα FWHM ~ 0.05° at 20° 2θ) Accurate Size Range < 90nm Rough Upper Limit < 180 nm Synchrotron (λ = 0.8 A, FWHM ~ 0.01° at 20°2θ) Accurate Size Range < 233 nm Rough Upper Limit = 470nm
Measures of Line Broadening The width of a diffraction line can be estimated by more than one criterion. The two most common width than one criterion. parameters are: Full Width at Half Maximum (FWHM) - ) - The width ofthe peak at 1/2 it’s maximum intensity. Integral Breadth (β)- The width of a rectangle with thesame height and area as the diffraction peak.
Calculation of crystallite size Scherrer (1918) first observed that small crystallite size could give rise to line broadening. He derived a well known equation for relating the crystallite size to the broadening, which is called the Scherrer Formula. d = Kλ/{ /{FWHM cos θ} d = crystallite size K = Scherrer somewhat arbitrary value that falls in the range 0.87-1.0 λ = the wavelength of the radiation FWHM of a reflection (in radians)located at 2θ. Now we are able to measure crystallite size!
From micro- to nanograin bulk materials COPPER • Copper is a “model material” • Very well known bulk properties • Many uses • Normal copper is microstructured • Grain size is 1–100 microns Jonathon Shanks, Michigan State University
From micro- to nano-grain bulk materials COPPER Metals can be madeintonanocrystalline materials that performbetter than regular metals. • Roll copper at the temperature of liquidnitrogen • Then, heat to around 450K Result: - structure with micrometersized grains and nanocrystallinegrains - Increased strength and hardness ofmetal because of the nanocrystallinegrains - high ductility www.research.ibm.com/ journal/rd/451/murray.html
Increasing Copper Strength • Plastic deformation of copper introduces work-hardening (copper gets stronger) and reduces the grain size • Hall-Petch relation predicts materials get stronger as grain size decreases: y = 0 + KHPd-1/2 (Yield strength is inversely proportional to grain size) Jonathon Shanks, Michigan State University
Increasing Copper Strength Jonathon Shanks, Michigan State University
Increasing Copper Strength Hall-Petch relation y = 0 + KHPd-1/2
A molecular dinamics simulated copper sample before (a) and after (b) 10% deformation. 16 grains, 100,000 atoms; average grain size: 5nm J. Schiotz et al., Nature, 391 (1998) 561
Reverse Hall-Petch effect(for Copper) J. Schiotz et al., Nature, 391 (1998) 561
Molecular Dynamics (MD) simulation • Zone beneath the indenter. • for the single crystal sample at a displacement of 12.3 Angstrom, • b) for the 12~nm grain sample at a displacement of 11.9Angstrom. Only non-FCC atoms are shown. http://sb2.epfl.ch/instituts/akarimi/small.html
From bulk materials to thin films • - how to deposit nanocrystalline thin films What are thin film growth models? How to control thin film growth? - How to control grain size? a) by substrate temperature b) by deposition rate c) by annealing temperature d) by film thickness
Thin film growth - island growth model • 1. Island growth (Volmer - Weber) • - three dimensional islands are formed • WHY: • - film atoms more strongly bound to each other than to substrate • - and/or slow diffusion • 2. Layer by layer growth (Frank - van der Merwe) • - generally highest crystalline quality • WHY: • - film atoms more strongly bound to substrate than to each other • - and/or fast diffusion http://www.uccs.edu/~tchriste/courses/PHYS549/549lectures/film2.html
Thin film growth - island growth model • 3. Mixed growth (Stranski - Krastanov) • - initially layer by layer • - then three dimensional islands are formed http://www.uccs.edu/~tchriste/courses/PHYS549/549lectures/film2.html
Grain size dependence on deposition conditions • Grain size typically increases with: • increasing film thickness, • increasing substrate temperature, • increasing annealing temperature, • - decreaseing deposition rate http://www.uccs.edu/~tchriste/courses/PHYS549/549lectures/film2.html
Structural zone models of thin film growth Movchan-Demischin (1969)
Structural zone models of thin film growth Thornton (1974)
Structural zone models of thin film growth Messier (1984)
Structural zone models of thin film growth http://www.uccs.edu/~tchriste/courses/PHYS549/549lectures/film2.html
Nanocrystalline thin films • Single component (metals deposited at low temperatures) • Binary and multicomponent alloys (limited solubility promotes nucleation and segregation of phases), • Carbides, nitrides, and oxides of metals deposited at high rates and low temperatures • NANOCOMPOSITES
Structure-performance relations in nanocomposite thin films J. Patscheider et al.., Surf. Coat. Technol. 146-147 (2001) 201
Structure-performance relations in nanocomposite thin films J. Patscheider et al.., Surf. Coat. Technol. 146-147 (2001) 201
Nanocomposite thin films • n-MeN/a-nitride (nMeN/a-Si3N4, where: Me=Ti, W, V) • n-MeN/n-nitride; for example: n-TiN/n-BN • n-MeC/a-C or a-C:H; for example: TiC/DLC; TiC/a-C:H, Mo2C/a-C:H • n-MeN/metal, for example: ZrN/Cu, CrN/Cu, Mo2N/Cu, Mo2N/Ag • n-WC + n-WS2/DLC • n-MeC/a-SiC, for example: TiC/a-SiC/a-C:H
Deposition of nanocomposite thin films Gulbinski, W. et al.., Applied Surface Science 239 (2005) 302–310
-MoC (101) a = 100% Intensywność (j.u.) b-Mo2C (100) a = 64% b-Mo2C (100) a = 46% Mo (110) a = 33% a = 25% 30 35 40 45 50 55 60 65 70 Kąt dyfrakcji 2J [°] C1s Intensywność (j.u.) a = 100% a = 64% 283,0 MoC a = 46% 284,2 a-C a = 25% 290 288 286 284 282 280 278 Energia wiązania (eV) Mo2C-MoC/a-C:H nanocomposite thin films XRD XPS Gulbinski, W. et al.., Inżynieria Materiałowa 6 (2003) 490
0,7 a = 25% a = 33% 0,6 a = 46% a = 64% m 0,5 0,4 Współczynnik tarcia 0,3 a = 100% 0,2 0,1 0,0 0 50 100 150 200 250 300 350 400 450 Temperatura [°C] Mo2C-MoC/a-C:H nanocomposite thin films Friction coefficient vs. test temperature Gulbiński, W. et al.., Inżynieria Materiałowa 6 (2003) 490
TiC/a-C:H nanocomposite thin films Gulbinski, W. et al.., Applied Surface Science 239 (2005) 302
TiC/a-C:H nanocomposite thin films Gulbinski, W. et al.., Applied Surface Science 239 (2005) 302
TiC/a-C:H nanocomposite thin films Gulbinski, W. et al.., Applied Surface Science 239 (2005) 302
Mo2N/Ag nanocomposite thin films Gulbinski, W. et al.., Surf. Coat. Technol. (2006) in press
Mo2N/Ag nanocomposite thin films Gulbinski, W. et al.., Surf. Coat. Technol. (2006) in press
Ni/a-C:H nanocomposite thin films S. Kukielka et al.. Surf.Coat. Technol. 200/22-23 (2006) 6258-6262
Ti-Si-C nanocomposite thin films W. Gulbinski et al.. Surf. Coat. Technol. 180-181 (2004) 341
Ti-Si-C nanocomposite thin films W. Gulbinski et al.. Surf. Coat. Technol. 180-181 (2004) 341 W. Gulbinski et al.. Surf. Coat. Technol. 200 (2006) 4179
Ti-Si-C nanocomposite thin films W. Gulbinski et al.. Surf. Coat. Technol. 200 (2006) 4179
CONCLUSIONS • Nanocrystalline or nanocomposite thin films show: • enhanced hardness, • enhanced ductility, • high toughness, • low friction • unusual dielectric and magnetic properties