Download
1 / 42
420 likes | 427 Views
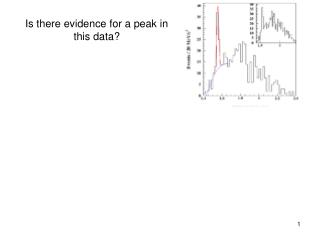
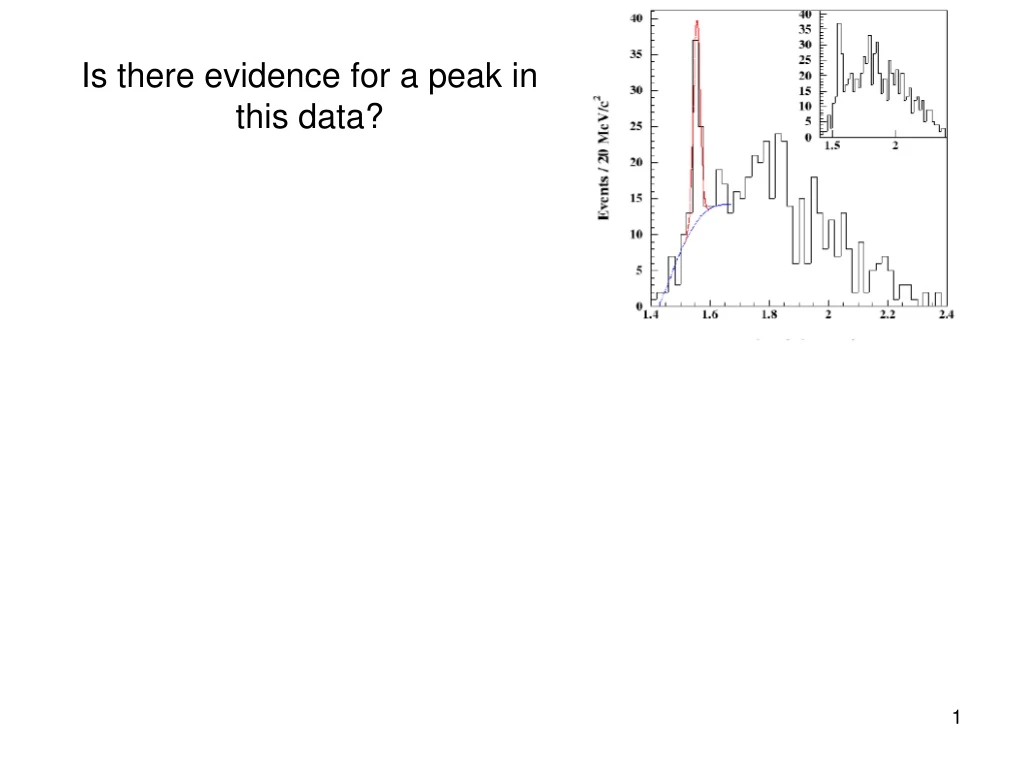
Is there evidence for a peak in this data?. Is there evidence for a peak in this data?. “Observation of an Exotic S=+1 Baryon in Exclusive Photoproduction from the Deuteron” S. Stepanyan et al, CLAS Collab, Phys.Rev.Lett. 91 (2003) 252001

E N D
Is there evidence for a peak in this data? “Observation of an Exotic S=+1 Baryon in Exclusive Photoproduction from the Deuteron” S. Stepanyan et al, CLAS Collab, Phys.Rev.Lett. 91 (2003) 252001 “The statistical significance of the peak is 5.2 ± 0.6 σ”
Is there evidence for a peak in this data? “Observation of an Exotic S=+1 Baryon in Exclusive Photoproduction from the Deuteron” S. Stepanyan et al, CLAS Collab, Phys.Rev.Lett. 91 (2003) 252001 “The statistical significance of the peak is 5.2 ± 0.6 σ” “A Bayesian analysis of pentaquark signals from CLAS data” D. G. Ireland et al, CLAS Collab, Phys. Rev. Lett. 100, 052001 (2008) “The ln(RE) value for g2a (-0.408) indicates weak evidencein favour of the data model without a peak in thespectrum.” Comment on “Bayesian Analysis of Pentaquark Signals from CLAS Data” Bob Cousins, http://arxiv.org/abs/0807.1330
Statistical issues in searches for New Phenomena:p-values, Upper Limits and Discovery Louis Lyons IC and Oxford l.lyons@physics.ox.ac.uk CERN Summer Students, July 2014
TOPICS Discoveries H0 or H0 v H1 p-values: For Gaussian, Poisson and multi-variate data What is p good for? Errors of 1st and 2nd kind What a p-value is not Combining p-values Significance Look Elsewhere Effect Blind Analysis Why 5σ? Setting Limits Case study: Search for Higgs boson
DISCOVERIES “Recent” history: Charm SLAC, BNL 1974 Tau lepton SLAC 1977 Bottom FNAL 1977 W, Z CERN 1983 Top FNAL 1995 {Pentaquarks ~Everywhere 2002 } Higgs CERN 2012 ? CERN 2015? ? = SUSY, q and l substructure, extra dimensions, free q/monopoles, technicolour, 4th generation, black holes,….. QUESTION: How to distinguish discoveries from fluctuations?
Penta-quarks? Hypothesis testing: New particle or statistical fluctuation?
H0 or H0 versus H1 ? H0 = null hypothesis e.g. Standard Model, with nothing new H1 = specific New Physics e.g. Higgs with MH = 125 GeV H0: “Goodness of Fit” e.g. χ2, p-values H0 v H1: “Hypothesis Testing” e.g. L-ratio Measures how much data favours one hypothesis wrt other H0 v H1 likely to be more sensitive for H1 or
p-values Concept of pdf y Example: Gaussian μ x0 x y = probability density for measurement x y = 1/(√(2π)σ) exp{-0.5*(x-μ)2/σ2} p-value: probablity that x ≥ x0 Gives probability of “extreme” values of data ( in interesting direction) (x0-μ)/σ 1 2 3 4 5 p 16% 2.3% 0.13% 0. 003% 0.3*10-6 i.e. Small p = unexpected
p-values, contd Assumes: Specific pdf for x (e.g. Gaussian, no long tails) Data is unbiassed σ is correct If so, and x is from that pdf uniform p-distribution (Events at large x give small p) Interesting region 0 p 1
p-values for non-Gaussian distributions e.g. Poisson counting experiment, bgd = b P(n) = e-b* bn/n! {P = probability, not prob density} b=2.9 P 0 n 10 For n=7, p = Prob( at least 7 events) = P(7) + P(8) + P(9) +…….. = 0.03
p-values and σ p-values often converted into equivalent Gaussian σ e.g. 3*10-7 is “5σ” (one-sided Gaussian tail) Does NOT imply that pdf = Gaussian (Simply easier to remember number of , than p-value.)
What is p good for? Used to test whether data is consistent with H0 Reject H0 if p is small : p≤α(How small?) Sometimes make wrong decision: Reject H0 when H0 is true: Error of 1st kind Should happen at rate α OR Fail to reject H0 when something else (H1,H2,…) is true: Error of 2nd kind Rate at which this happens depends on……….
Errors of 2nd kind: How often? e.g.1. Does data lie on straight line? Calculate χ2y Reject if χ2 ≥ 20 x Error of 1st kind: χ2 ≥ 20 Reject H0 when true Error of 2nd kind: χ2< 20 Accept H0 when in fact quadratic or.. How often depends on: Size of quadratic term Magnitude of errors on data, spread in x-values,……. How frequently quadratic term is present Compromise on error rates
Errors of 2nd kind: How often? e.g. 2. Particle identification (TOF, dE/dx, Čerenkov,…….) Particles are π or μ Extract p-value for H0 = π from PID information π and μhave similar masses p 0 1 Of particles that have p ~ 1% (‘reject H0’), fraction that are πis a) ~ half, for equal mixture of π and μ b) almost all, for “pure” π beam c) very few, for “pure” μbeam
p-value is not …….. Does NOT measure Prob(H0 is true) i.e. It is NOT P(H0|data) It is P(data|H0) N.B. P(H0|data) ≠ P(data|H0) P(theory|data) ≠ P(data|theory) “Of all results with p ≤ 5%, half will turn out to be wrong” N.B. Nothing wrong with this statement e.g. 1000 tests of energy conservation ~50 should have p ≤ 5%, and so reject H0 = energy conservation Of these 50 results, all are likely to be “wrong”
Combining different p-values ******* Better to combine data ************ Several results quote independent p-values for same effect: p1, p2, p3….. e.g. 0.9, 0.001, 0.3 …….. What is combined significance? Not just p1*p2*p3….. (If 10 expts each have p ~ 0.5, product ~ 0.001 and is clearly NOT correct combined p) N.B. Problem does not have unique answer S = z * (-ln z)j / j! , z = p1p2p3……. (e.g. For 2 measurements, S = z * (1 - lnz) ≥ z )
Significance • Significance = S/B ? • Potential Problems: • Uncertainty in B • Non-Gaussian behaviour of Poisson, especially in tail • Number of bins in histogram, no. of other histograms [LEE] • Choice of cuts (Blind analyses) • Choice of bins (……………….) • For future experiments: • Optimising cuts: Could give S =0.1, B = 10-4, S/B =10 • N.B. S/ (S+B) also has problems • Best to use proper Poisson p
Look Elsewhere Effect See ‘peak’ in bin of histogram Assuming null hypothesis, p-value is chance of fluctuation at least as significant as observed ………. • at the position observed in the data; or • anywhere in that histogram; or • including other relevant histograms for your analysis; or • including other analyses in Collaboration; or • in any CERN experiment; or etc. Contrast local p-value with ‘global’ p-value Specify what is your ‘global’
BLIND ANALYSES Why blind analysis? Selections, corrections, method Methods of blinding Add random number to result * Study procedure with simulation only Look at only first fraction of data Keep the signal box closed Keep MC parameters hidden Keep unknown fraction visible for each bin After analysis is unblinded, …….. * Luis Alvarez suggestion re “discovery” of free quarks
Why 5σ? • Past experience with 3σ, 4σ,… signals • Look elsewhere effect: Different cuts to produce data Different bins (and binning) of this histogram Different distributions Collaboration did/could look at Other analyses in Physics subgroup, expt, CERN,… . Worries about systematics (easily under-estimated?) • Bayesian priors: P(H0|data)P(data|H0) * P(H0) P(H1|data)P(data|H1) * P(H1) Bayes posteriorsLikelihoods Priors Prior for {H0 = S.M.} >>> Prior for {H1 = New Physics}
Why 5σ? BEWARE of tails, especially for nuisance parameters Same criterion for all searches Different LEE (contrast muon magnetic moment v. CMS) Different role of systematics Different Bayes priors, e.g. Single top production Higgs Highly speculative particle Energy non-conservation Blind analysis helps
Choosing between 2 hypotheses Hypothesis testing: New particle or statistical fluctuation? H0 = b H1 = b + s
Choosing between 2 hypotheses Possible methods: Δχ2 p-value of statistic lnL–ratio Bayesian: Posterior odds Bayes factor Bayes information criterion (BIC) Akaike …….. (AIC) Minimise “cost” See ‘Comparing two hypotheses’ http://www.physics.ox.ac.uk/users/lyons/H0H1_A~1.pdf
(a) (b) H0 H1 tobs t t tobs p1 p0 (c) With 2 hypotheses, each with own pdf, p-values are defined as tail areas, pointing in towards each other H0 H1 tobs t
Procedure for choosing between 2 hypotheses 1) No sensitivity 2) Maybe 3) Easy separation H0H1 t β tcritα Procedure: Choose α (e.g. 95%, 3σ, 5σ ?) and CL for β (e.g. 95%) Given b,α determines tcrit s defines β. For s > smin, separation of curves discovery or excln 1-β = Power of test Now data: If tobs ≥ tcrit (i.e. p0 ≤ α), discovery at level α If tobs< tcrit, no discovery. If p1 < 1– CL, exclude H1
LIMITS Look for New Physics s See no effect. Set upper limit on s If s < sexpected, exclude this sort of New Physics HEP experiments: If UL on rate for new particle production expected, exclude particle Big industry in Particle Physics Michelson-Morley experiment death of aether CERN CLW (Jan 2000) FNAL CLW (March 2000) Heinrich, PHYSTAT-LHC, “Review of Banff Challenge”
SIMPLE PROBLEM? Gaussian ~ exp{-0.5*(x-μ)2/σ2} , with data x0 No restriction on param of interest μ; σ known exactly μ≤ x0 + k σ BUT Poisson {μ = sε + b} s ≥ 0 ε and b with uncertainties Not like : 2 + 3 = ? N.B. Actual limit from experiment ≠Expected (median) limit
Methods Bayes (needs priors e.g. const, 1/μ, 1/√μ, μ, …..) Frequentist (needs ordering rule, possible empty intervals, F-C) Likelihood (DON’T integrate your L) χ2 (σ2 =μ) χ2(σ2 = n) Also have to incorporate systematics Recommendation 7 from CERN CLW (2000): “Show your L” 1) Not always practical 2) Not sufficient for frequentist methods
Poisson counting expt Expected bgd = b Observe n Set UL for possible signal s Ilya Narsky, FNAL CLW 2000
DESIRABLE PROPERTIES • Coverage • Interval length • Behaviour when n < b • Limit increases as σb increases • Unified with discovery and interval estimation
INTERVAL LENGTH Empty Unhappy physicists Very short False impression of sensitivity Too long loss of power (2-sided intervals are more complicated because ‘shorter’ is not metric-independent: e.g. 0 9 or 4 16 for x2 cf 0 3 or 2 4 for x )
Recommendations? CDF note 7739 (May 2005) Decide method and procedure in advance No valid method is ruled out Bayes is simplest for incorporating nuisance params Check robustness Quote coverage Quote sensitivity Use same method as other similar expts Explain method used
Case study: Successful search for Higgs boson (Meeting of statisticians, atomic physicists, astrophysicists and particle physicist: “What is value of H0?”) H0 very fundamental Wanted to discover Higgs, but otherwise exclude {Other possibility is ‘Not enough data to distinguish’}
Comparing 0+ versus 0- for Higgs http://cms.web.cern.ch/news/highlights-cms-results-presented-hcp
Summary • P(H0|data) ≠ P(data|H0) • p-value is NOT probability of hypothesis, given data • Many different Goodness of Fit tests Most need MC for statistic p-value • For comparing hypotheses,Δχ2is better thanχ21andχ22 • Blind analysis avoids personal choice issues • Different definitions of sensitivity • Worry about systematics • H0 search provides practical example PHYSTAT2011 Workshop at CERN, Jan 2011 (pre Higgs discovery) “Statistical issues for search experiments” Proceedings on website http://indico.cern.ch/conferenceDisplay.py?confId=107747
Overall Conclusions 1) Best of luck with your statistical analyses 2) Your statistical analysis should do justice to your data 3) Your problem has probably occurred before, and maybe has been solved Consult text-books, and statistics information on the web, e.g. CDF Statistics Committee CMS Statistics Committee Particle Data Group Statistics Before re-inventing the wheel, try to see if Statisticians have already found a solution to your statistics analysis problem. Don’t use your own square wheel if a statistician’s circular one already exists 4) Send me an e-mail (l.lyons@physics.ox.ac.uk )