Download
1 / 19
200 likes | 233 Views
Molecular Markers. Dr. B. D. Ranjitha Kumari Professor and Head Department of Botany. Restriction fragment length polymorphism ( RFLP) variation in the DNA sequence of a genome that can be

E N D
Molecular Markers Dr. B. D. Ranjitha Kumari Professor and Head Department of Botany
Restriction fragment length polymorphism (RFLP) • variation in the DNA sequence of a genome that can be • detected by breaking the DNA into pieces with restriction enzymes • and analyzing the size of the resulting fragments by gel electrophoresis.
Steps involved in RFLP analysis • DNA isolation • Cutting DNA into smaller fragments using restriction enzymes • Separation of DNA fragments by gel electrophoresis • Transferring DNA fragments to a nylon or nitrocellulose membrane filter • visualization of specific DNA fragments using Labeled probes Analysis of results • An RFLP occurs when the size of a detected fragment varies between individuals. • Each fragment size is considered an allele, and can be used in genetic analysis
Applications of RFLP • It permits the direct identification of a genotype or cultivar in any tissue at any developmental stages in an environment independent manner. • no sequence specific informations are required • genes that are known to be linked with RFLP loci can be isolated and characterized • fingerprinting of strains/varieties for their genetic polymorphism • linkage mapping of QTL • Understanding the identity and function of polygenes
Steps involved in the Construction of RFLP map Select the parent plants: DNA is isolated and digested with enzyme and screened for polymorphism Produce a mapping population: selected plants are crossed to produce F1s. F2s or backcrosses can be used scoring the RFLPs in the mapping population for polymorphism Problems Requires relatively large amount of pure DNA Constant supply of probes are needed. It is laborites and expensive to identify suitable marker/restriction enzyme RFLPs are time consuming as they are not amenable to automation. RFLP work is carried out using radioactively labeled probes and therefore requires expertise in autoradiography
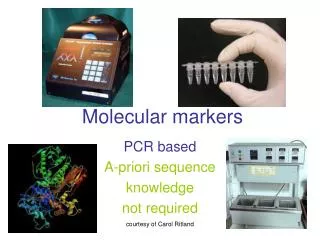
Amplified fragment length polymorphism (AFLP) • PCR-based tool used in genetics research, DNA fingerprinting, and in the practice of genetic engineering. • AFLP-PCR is a highly sensitive method for detecting polymorphisms in DNA. Procedure of this technique is divided into three steps • Digestion of total cellular DNA with one or more restriction enzymes and ligation of restriction half-site specific adaptors to all restriction fragments. • Selective amplification of some of these fragments with two PCR primers that have corresponding adaptor and restriction site specific sequences. • Electrophoretic separation of amplicons on a gel matrix, followed by visualisation of the band pattern.
A variation on AFLP is cDNA-AFLP, which is used to quantify differences in gene expression levels. • Another variation on AFLP is TE Display, used to detect transposable element mobility APPLICATIONS • Capability to detect various polymorphisms in different genomic regions simultaneously. • It is also highly sensitive and reproducible. So genetic variation in strains or closely related species of plants, fungi, animals, and bacteria can be found • The AFLP technology has been used in criminal and paternity tests • in population genetics to determine slight differences within populations, and in linkage studies to generate maps for quantitative trait locus (QTL) analysis.
Marker assisted selection (MAS) • A marker (morphological, biochemical or DNA/RNA variation) is used for indirect selection for determinants of a trait of interest (i.e. productivity, disease resistance, abiotic stress tolerance, and/or quality). • MAS is being used to select individuals with a disease, the level of disease is not quantified but rather a marker allele which is linked with disease is used to determine disease presence. • MAS can be useful for traits that are difficult to measure, exhibit low heritability or expressed late in development.
Markers Morphological presence or absence of awn, leaf sheath coloration, height, grain color, aroma of rice Biochemical A gene that encodes a protein that can be extracted and observed for example, isozymes and storage proteins. Cytological -The chromosomal banding produced by different stains (G banding). Biological Different pathogen races or insect biotypes identified based (on host pathogen or host parasite interaction) DNA-based and/or molecular- A unique DNA sequence can be identified by a range of molecular techniques (RFLPs, RAPDs, AFLP, SCARs, microsatellites)
Situations that are favorable for molecular marker selection • The selected character is expressed late in plant development (like fruit and flower features or adult characters with a juvenile period) • The expression of the target gene is recessive • The phenotype is affected by two or more unlinked genes (epistatis). • (Selection for multiple genes which provide resistance against diseases or insect pests for gene pyramiding)
Steps for MAS • DNA isolation • PCR and Gel electrophoresis: • Resistant and susceptible plants have different banding patterns. Susceptible ones are eliminated • markers to be used should be close to gene of interest (recombination unit ) in order to ensure that only minor fraction of the selected individuals will be recombinants. • Generally, not only a single marker but rather two markers are used in order to reduce the chances of an error due to homologous recombination
QUANTITATIVE TRAIT LOCI refers to the inheritance of a phenotypic characteristic that varies in degree and can be attributed to the interactions between two or more genes and their environment. • Quantitative trait loci (QTLs) are stretches of DNA that are closely linked to the genes that underlie the trait in question. • Unlike monogenic traits, polygenic traits do not follow patterns of Mendelian inheritance . • Typically, QTLs underlie continuous traits (those traits that vary continuously - the trait could have any value within a range - e.g., height) • Moreover, a single phenotypic trait is usually determined by many genes. Consequently, many QTLs are associated with a single trait eg) yield.
A quantitative trait locus (QTL) is a region of DNA that is associated with a particular phenotypictrait - these QTLs are often found on different chromosomes. • Knowing the number of QTLs that explains variation in the phenotypic trait tells us about the genetic architecture of a trait. It may tell us that plant height is controlled by many genes of small effect, or by a few genes of large effect. • Another use of QTLs is to identify candidate genes underlying a trait. Once a region of DNA is identified as contributing to a phenotype, it can be sequenced..
QTL mapping • QTL mapping is the statistical study of the alleles that occur in a locus and the phenotypes (physical forms or traits) that they produce. • a set of genetic markers must be developed for the species • When a QTL is found, it is often not the actual gene underlying the phenotypic trait, but rather a region of DNA that is closely linked with the gene. • . If the genome is not available, it may be an option to sequence the identified region and determine the putative functions of genes
Analysis of variance • The simplest method for QTL mapping is analysis of variance (ANOVA, sometimes called "marker regression") at the marker loci. • In this method, in a backcross, one may calculate a t-statistic to compare the averages of the two marker genotype groups. • For other types of crosses (such as the intercross), where there are more than two possible genotypes, one uses a more general form of ANOVA, which provides a so-called F-statistic.
Interval Mapping • Lander and Botstein developed interval mapping, which overcomes the three disadvantages of analysis of variance at marker loci. • The method makes use of a genetic map of the typed markers, and, like analysis of variance, assumes the presence of a single QTL.
Advantages Speed – DNA can be extracted from tissue from the first leaves or the cotyledons of a plant. Trait information can be discovered with markers prior to pollination allowing more informed crosses to be made. Consistency – Markers remove the impact of environmental variation that often complicates phenotypic evaluation. Biosafety – Using markers in screening for disease resistance means not having to introduce the pathogen into breeding populations. Efficiency – Screening progeny early in the process allows a breeder to program more quickly. Complex traits – Most multigenic traits are very difficult to manage through conventional plant breeding. Markers allow you to skew the odds in your favour.
References • Plant breeding by V. Kumaresan, 2012. Saras Publication • https://en.wikipedia.org/wiki/Molecular_marker. • https://thepoetrytrust.org/restriction-fragment-length-polymorphism-essay. • https://www.slideshare.net.