Download
1 / 28
280 likes | 469 Views
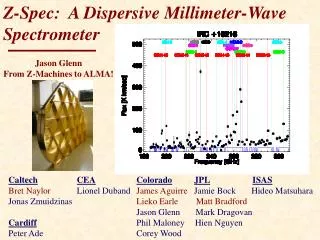
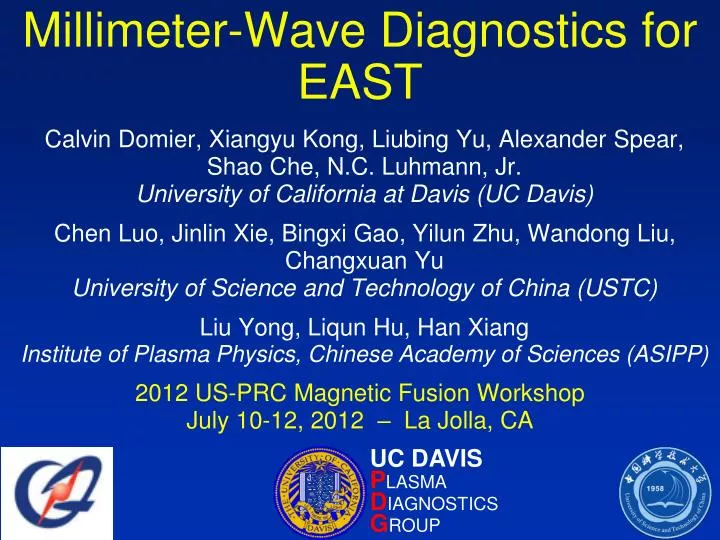
Millimeter-Wave Diagnostics for EAST. Calvin Domier , Xiangyu Kong , Liubing Yu , Alexander Spear , Shao Che, N.C. Luhmann, Jr. University of California at Davis (UC Davis)

E N D
Millimeter-Wave Diagnostics for EAST Calvin Domier, Xiangyu Kong, Liubing Yu, Alexander Spear, Shao Che, N.C. Luhmann, Jr.University of California at Davis (UC Davis) Chen Luo, Jinlin Xie, Bingxi Gao, Yilun Zhu, Wandong Liu, Changxuan YuUniversity of Science and Technology of China (USTC) Liu Yong, Liqun Hu, Han XiangInstitute of Plasma Physics, Chinese Academy of Sciences (ASIPP) 2012 US-PRC Magnetic Fusion WorkshopJuly 10-12, 2012 –La Jolla, CA UC DAVIS PLASMA DIAGNOSTICS GROUP
Outline • Wideband ECE Radiometer • 32 channel radiometer collects 2nd harmonic X-mode ECE radiation spanning a frequency range of 104 to 168 GHz • Collaborative effort with the Institute of Plasma Physics, Chinese Academy of Sciences (ASIPP) in Hefei, China • ECE Imaging (ECEI) • High resolution 2-D ECEI system generates 24x16 images of Te profiles and fluctuations in the EAST plasma • System spans an RF bandwidth of 14.4 GHz, and is tunable over a frequency range of 102 to 150 GHz • Collaborative effort with the University of Science and Technology of China (USTC) in Hefei, China
Electron Cyclotron Emission (ECE) Electron gyromotion results in Electron Cyclotron Emission (ECE) at a series of discrete harmonic frequencies: ωn =nωce In an optically thick plasma, the ECE radiation intensity is the black body intensity (Rayleigh-Jeans Region): In tokamak plasmas, there is a one to onemapping between frequency and radial positiondue to 1/R dependence of magnetic field B. ωceµ B µ1/R ECE has become a standard technique tomeasure Te profiles and fluctuations inmagnetic fusion plasmas fce ECE R B
ECE Heterodyne Radiometer System BS1 BS2 BS3 152-168 GHz • Schematic illustration of the EAST radiometer receiver • Plasma radiation enters from the left To Band 4 104-168 GHz 75 GHz 120-136 GHz 136-152 GHz 104-120 GHz Dichroic Plate HDPE Lens 67 GHz 51 GHz 59 GHz Subharmonic Mixer To Band 2 To Band 3 To Band 1
ECE Heterodyne Radiometer System • Photograph of the EAST radiometer receiver. • Plasma radiation enters from the right
Sub-harmonic Receiver • Each receiver consist of a sub-harmonic mixer pumped by a solid state Gunn oscillator • ECE radiation is downconverted, amplified by a 2-18 GHz low noise preamplifier placed within the shielded enclosure • Three translation stages provide full alignment capability, with a vertical stage mounted within and a horizontal stage mounted below the enclosure box, and an axial (focusing) stage mounted underneath a focusing lens placed in front of the receiver
ECE Radiometer Electronics • The output of each receiver is amplified further using a second low noise 2-18 GHz pre-amplifier, and is divided into two parts • One half is lowpass filtered and feeds the four lower frequency channels, while the other half feeds the four higher frequency channels • A four-wave power divider splits each of these signals again, with the resultant 8 channels all passing through individual bandpass filters(~500 MHz wide) before getting rectified by coaxial detectors and connecting to an 8-channel video amplifier/filter board
2-D ECE Imaging (ECEI) fce • Technological advancements allow an extension of well-established principles of heterodyne radiometry. • Real-time Te down to <1%or µ-sec time resolution • Up to 1 cm2 spatial resolution • 2-D localized measurements using wideband IF electronics and single sideband detection. R fce R
Double Downconversion Approach (1) A characteristic frequency plot forthe EAST tokamak (BT=2.1 T) is shown left, showing X-mode ECE spanning 94 GHz to >160 GHz LO Antennas LO1 Plasma Optics LP Filters ADCs Mixers Detectors LOn Notch Filter Dichroic Plate Mixers
Quasi-optical notch filter prevents transmission of a narrow band of frequencies to protect against stray 140 GHz ECRH Double Downconversion Approach (2) LO Antennas LO1 Plasma Optics LP Filters ADCs Mixers Detectors LOn Notch Filter Dichroic Plate Mixers
Dichroic plate ensures single sideband operation: effect offcutoff = 110 GHz plate shown left Double Downconversion Approach (3) LO Antennas LO1 Plasma Optics LP Filters ADCs Mixers Detectors LOn Notch Filter Dichroic Plate Mixers
Antennas receive broadband ECE, downconvert by fLO(at or near fcutoff), and amplified: example shows fLO=110 GHz combined with 2-20 GHz amplifiers Double Downconversion Approach (4) LO Antennas LO1 Plasma Optics LP Filters ADCs Mixers Detectors LOn Notch Filter Dichroic Plate Mixers
Downconverted 2-20 GHz signals are split into n bands and downconverted a second time by frequencies fLO1 through fLOn in the 2-9.2 GHz range: shown left are two such channels Double Downconversion Approach (5) LO Antennas LO1 Plasma Optics LP Filters ADCs Mixers Detectors LOn Notch Filter Dichroic Plate Mixers 2.5 8.8 f (GHz)
Final step is to lowpass filter the n band signals, reducing the radial spot size and providing sharp band edges suitable for cross correlation studies Double Downconversion Approach (6) LO Antennas LO1 Plasma Optics LP Filters ADCs Mixers Detectors LOn Notch Filter Dichroic Plate Mixers 2.5 8.8 f (GHz)
Conventional ECEI: 8-Channel RF Layout 2.5/3.32 GHz Filters 3.4/4.0 GHz 4.3/4.6 GHz 6-bitAttenuator 5.2 GHz Power Dividers 0-31.5 dB 6.1/5.8 GHz 7.0/6.4 GHz 7.9/7.0 GHz 8.8/7.6 GHz Mixers
New for EAST: 16-Channel RF Layout 9.7 GHz 10.6 GHz 2- 16.4 GHz Input HPF 11.5 GHz 20 dB 6-bit Attenuator 12.4 GHz 0-31.5 dB 13.3 GHz 20 dB 14.2 GHz To Lower8 channels 15.1 GHz HPF 20 dB x2 8.0 GHz Mixers Doubler
ECEI Optical Design Beam Waist Vacuum Window Zoom Optics Plasma Edge Focuser Toroidal Corrective Lens Toroidal Colliminating Lens ECEI Array • Zoom optics can control the vertical spacing between antenna elements over a factor of 2X, from 11.5-13.8 mm to as high as 21.5-24.5 mm • Focuser lens determines the beam waist position within the plasma,can be set to -26.7cm ≤ r ≤ +55.2cm in the narrowest zoom configuration
ECEI Gaussian Beam Simulations • In narrow zoom, the Gaussian beams are focused at the plasma edge (left), and at its deepest location (right). • Focused on the magnetic axis, the image plane is adjusted from narrow zoom (left) to wide zoom (right). Narrow, Deepest Narrow, Edge Wide, Magnetic Axis Narrow, Magnetic Axis
ECEI Beam Energy Simulations • The full diffractive characteristics of beam energy passing through system apertures is revealed through the use of numerical techniques employing Beam Propagation Method(BPM). • Plotted here are the focal plane patterns at the magnetic axis in the narrow zoom position for the edge (left) and center (right) channels.
ECEI Focal Plane Measurements • Focal plane scans using a translatable scattering rod (functions as a line source) confirm good imaging performance • Shown above are the E-plane (vertical) focal plane patterns of the centermost 8 channels, with fitted gaussians (─) superimposed over raw data (─)
ECEI Installed on EAST ECEI Optics ECEI Electronics Cabinet BWO
ECEI Electronics on EAST • ECEI electronics consist of power supply/controllers and ECEI modules (8 per rack) • ECEI electronics and high speed digitizers placed in shielded rack • All 384 ECEI signals can be simultaneously sampled at2 MHz for 6 sec DAQ DAQ DAQ DAQ