Download
1 / 29
290 likes | 291 Views
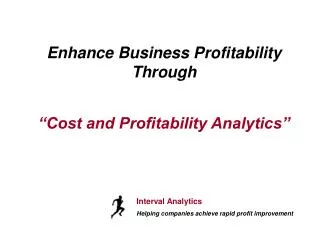
Linking Performance and profitability. William Owad, VP Performance Improvement Dublin, Ohio. Cardinal Health. Manufactures pharmaceuticals for 9 out of the top 10 pharma companies and most leading biotech firms Manufactures or packages nearly 500 million doses of pharmaceutical products

E N D
Linking Performance and profitability William Owad, VP Performance Improvement Dublin, Ohio
Cardinal Health • Manufactures pharmaceuticals for 9 out of the top 10 pharma companies and most leading biotech firms • Manufactures or packages nearly 500 million doses of pharmaceutical products • Dispenses 5 million doses of medication and 1million medical supplies through its Pyxistm automated dispensing systems • Employs more than 1800 pharmacists and 1000 scientists, PhD's
Cardinal Health • Provides more than 1000 hours of temporary staffing in retail pharmacy chains, hospitals, mail order pharmacies, HMO’s, home infusion companies, and long-term facilities • Makes over 40,000 deliveries of pharmaceutical and medical / surgical products • Ships more than 2.5 million pharmaceutical products, specialty pharmacy products and medical surgical supplies • Holds more than 1500 patents worldwide • Delivers unit-doses of radiopharmaceuticals to 90 percent of U.S. hospitals within 3 hours
Cardinal Health • 28 medical/surgical manufacturing plants and 47 medical/surgical distribution centers • 24 pharmaceutical distribution centers in the U.S. • 38 pharmaceutical manufacturing, laboratory and packaging facilities in 11 countries
Starting Assumptions / Partners • The presentation reflects a model that is “under construction” ( approx. 60,000 data points) • Initial findings and future directions • Key Partners • Westhill Partners, New York, NY • Applied Research Concepts (ARC), New York, NY
The Starting Point – Linking How and What A simple idea: Value CreationT$R Employee Attitudes Customer Satisfaction Lagging Leading Leading “How” “What”
Invested Capital Return on Invested Capital Cost of Capital Key Value Linkages Intrinsic value, and therefore market value, can be linked to the decisions we make about how to run our business, as well as where and how to compete Management Model and Business Model Market Economics and Competitive Position Intrinsic Value Market Value Intrinsic value is controlled by management
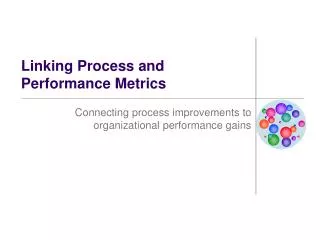
Expanding The Model A simple idea: Value CreationT$R Leadership Actions Employee Attitudes Customer Loyalty Operational Performance Management Model
The Causal Chain Interlocking Series of Influence and Outcomes EMPLOYEE ENGAGEMENT CUSTOMER SATISFACTION EBIT GROWTH PURCHASE INTENT REVENUE Employee Attitudes Affect Customer Experience Customer Experience Shapes Buying Intention Buying Intention Directly Affects Revenue Revenue Translates Into Operating Profit Incr.
The Causal Chain Existing Data/Research Provides Basis For Analysis EMPLOYEE ENGAGEMENT CUSTOMER SATISFACTION EBIT GROWTH RE-PURCHASE INTENT REVENUE Sales and Operating History Employee Engagement Research Customer Satisfaction Research
Alignment of Measures • Leadership Actions • 360 Degree Reviews • Common Review Dates (Performance Appraisal Data) • HR Capital Reviews (Career Development Planning and execution) • Turnover • Operational Excellence • Growth Metrics • Operational Excellence Measures • Defects • Service levels • EH&S data • Complaints • Facility / technology metrics
Alignment of Measures • Employee Engagement • Standard Instrument ( 2 time periods) • Modifying research schedule • Customer Loyalty • Standardized Core Questions / Deployment • Overall satisfaction • Intent to repurchase • Intent to recommend • Total Shareholder Return • Revenue • Earnings • ROIC
Honesty Timely delivery Accuracy Responsiveness Competitive Pricing Customer Perceptions “Purchase behavior” “Most important” What they “actually”do • Honesty • Expertise • Responsiveness • Innovation • Quality “Intent to purchase” “Most descriptive” What they “say”about Cardinal Health What they “intend”to do • Expertise • Partnership • Responsiveness • Long term relationship • Consistency • Honesty • Timely delivery • Professionalism • Fairness & clarity in billing • Accuracy
“Causal” Interaction Among Elements Although inherently less influential, small changes in Employee attitudes… 1 EMPLOYEE ENGAGEMENT …Create meaningful changes in the highly influential area of Service perception… 2 …And generates EBIT growth CUSTOMER SATISFACTION 3 4 PURCHASE INTENT EBIT GROWTH …Which in turn, lifts “Intent to Renew”. Achieving EBIT growth from customers is all about increasing their re-purchase intent. That’s where the EBIT leverage resides.
EBIT Influence: Service Trumps EE • If we were able to remove each element from the causal chain and examine them on a stand-alone basis, we’d see that Service inherently exerts significantly greater INFLUENCE on EBIT growth than EE. • For example, within a business unit, Service perceptions areten timesmore influential in creating “Renewal” growth than Employee attitudes. 1x 10x
Each Employee Dimension Affects Every Service Dimension. Leverage Is Significant • Within the real-world context of the causal chain, Employee attitudes possess real LEVERAGE in terms of generating EBIT growth • This is due to the fact that each EE attribute affects a large number of highly influential Service dimensions.
Business Unit 1 , Service Perception Is 3.5x More Contributory Than Employee Attitudes • A 2% increase in the strength of all Employee attributes • …Elevates highly influential Service perceptions • …And generates $650,000 of EBIT • A 2% increase in the strength of all Service attributes • …Elevates the all-important “Intent to Renew” score • …And generates $2,300,000 of EBIT EMPLOYEE ENGAGEMENT CUSTOMER SATISFACTION PURCHASE INTENT EBIT GROWTH
Linkage Statistics Are Very Robust R-square indicates portion of variability accounted-for (1.00 = 100%) EMPLOYEE ENGAGEMENT CUSTOMER SATISFACTION PURCHASE INTENT REVENUE EBIT 0.105 R-square 0.694 0.619 0.985 Employee-to-Customer Satisfaction is the weakest link
Influence Of Employee Attitudes Is Apparent. Financial Impact Is Modest EMPLOYEE ENGAGEMENT CUSTOMER SATISFACTION PURCHASE INTENT REVENUE EBIT 7.3% 4.4% Influence of Employee Perception
Conversely, Customer Service Perception Has A Profound Business Influence Influence of Customer Perception 69.4% 42.3% EBIT GROWTH EMPLOYEE ENGAGEMENT CUSTOMER SATISFACTION PURCHASE INTENT REVENUE 7.3% 4.4% Influence of Employee Perception
Example Of How Influential Service Attributes Feed Top Service Dimensions SERVICE ATTRIBUTES SERVICE DIMENSIONS PRIMARY OUTCOME • Reprocessing (142.5) • Departmental Inventory Mgmt. (131.0) • Low Unit of Measure/JIT (124.4) • Customized Online Reporting (122.3) • Guaranteed Invoice Accuracy (108.2) ENHANCED SERVICES RETURNS/REPLACEMENTS OVERALL SERVICE • Quick Return Authorization (117.8) • Quick Returns Pickup (113.9) • Turnaround Time for Rec. Credit (112.4) ORDER PLACE/DELIVERY PURCHASE INTENT SALES PRESENTATION • Enhanced Services (145.4) • Flexibility of Stocking Req. (139.2) • Value Received for Money Spent (125.1) • Breadth of Product Line (118.2) • Delivery Services (116.2) SERVICE SPEC./FSR CUSTOMER SERVICE DRIVER
"Overall Service" Dimensions 150 145.4 139.2 125.1 118.2 116.2 113.3 112.7 105.7 103.2 Value for Money Flex. Stock Req. Returns/Replacement 100 Influence Index Enhanced Svcs. Svc. Spec./FSR Product Breadth Sales Rep. Delivery Svcs. Order Place Delivery Freq. 91.4 90.0 98.0 Cust. Svc. Rep. Driver 50 MPS: Influence of Attributes Within “Overall Service” Dimension
Even Small Fluctuations In Attribute Strength Carry Large EBIT Impact
Working Our Way Upstream 4 3 2 1 EMPLOYEE ENGAGEMENT CUSTOMER SATISFACTION PURCHASE INTENT REVENUE EBIT • Used 2004 and 2001 Employee Engagement surveys • Linked responses to Operating Units by geographical location • 80+ Attributes
Example Of How Influential Employee Attributes Feed Top Service Dimensions EMPLOYEE ATTRIBUTES SERVICE DIMENSIONS PRIMARY OUTCOME • CAH Supports Development (154.4) • Open & Honest Communication (144.1) • Achieve Work/Life Balance (143.4) • Reprocessing (142.5) • Departmental Inventory Mgmt. (131.0) • Low Unit of Measure/JIT (124.4) • Customized Online Reporting (122.3) • Guaranteed Invoice Accuracy (108.2) 125.7 ENHANCED SERVICES • Achieve Work/Life Balance (137.0) • Mgr. Effectively Communicates (131.5) • Mgr. Listens To My Ideas (122.2) 114.7 • People are Treated Fairly (147.5) • CAH Values Diversity (146.7) • CAH Takes Steps (145.0) • Quick Return Authorization (117.8) • Quick Returns Pickup (113.9) • Turnaround Time for Rec. Credit (112.4) RETURNS/REPLACEMENTS • Enhanced Services (145.4) • Flexibility of Stocking Req. (139.2) • Value Received for Money Spent (125.1) • Breadth of Product Line (118.2) • Delivery Services (116.2) 113.2 • People are Treated Fairly (140.0) • Given Decision Making Authority (138.5) • Driven To High Standards (137.3) OVERALL SERVICE
Expanding The Model A simple idea: Value CreationT$R Leadership Actions Employee Attitudes Customer Loyalty Operational Performance Management Model
Evolution of Measurement Integration T$R EMPLOYEE CUSTOMER EE Outcomes Operationalize and Institutionalize LEVEL 3 Enhance, update and/or create individual analytical components of predictive model LEVEL 2 Identify, gather and prep source data for interlocking LEVEL 1
Next Steps • Folding in all remaining Customer Loyalty research • Inserting Operational Excellence data • Inserting additional Leadership Metrics • Evaluating Changes to “scorecard” • Investigating relationship to Revenue, EBIT and ROIC