Download
1 / 24
240 likes | 468 Views
Demographic Transition. Demographic Transition . Shows how population changes over time Knowing where a country falls on the model lets you know what kind of economy that country has & much more! . It’s a crystal ball!.

E N D
Demographic Transition
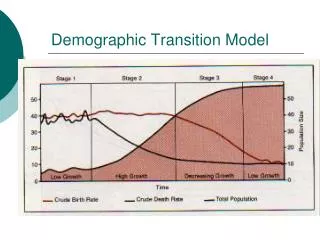
Demographic Transition • Shows how population changes over time • Knowing where a country falls on the model lets you know what kind of economy that country has & much more!
It’s a crystal ball! If country currently falls in stage 2, the model can be used to predict how its population will change over time and how much it will grow
The world falls in an early stage 3 • Knowing this we can estimate a population projection that the planet’s population has only reached about two-third’s of its potential • If we are currently at 6.9 billion, then we can expect once global populations level off in stage 4, our population will be somewhere around 10 billion. • This could happen around 2060!!!
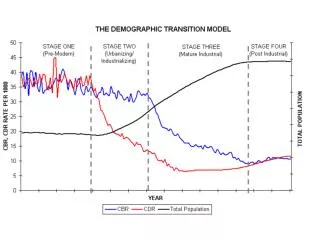
Let’s Break it down Stage by Stage!
Stage 1 • Characterized by pre-agricultural societies engaged in subsistence farming and transhumance • Subsistence- growing enough to feed your family • Transhumance- seasonal migration for food and resources
Stage 1 • Birth and death rates fluctuate
Why high birth rates? • Children were an expression of a family’s productivity and status • Status of women • Because of high infant mortality rates
Why high death rates? • Overall population has a very low life expectancy • Lack of modern medicine and health care • Limited sanitation • Low nutritional standards • Famine • War
Stage 2 • Typically agricultural-based economies • Difference from stage 1? Its usually agriculture for trade, instead of subsistence • Rate of natural increase goes up significantly, as birth & death rates grow apart…, so as a country advances the population explodes
Birth rate in Stage 2 • When you move to a more formalized agricultural based economy children are even more important as a source of labor on farms • Role of women has not changed
Death Rates in Stage 2 • Seasonal migrations decreases, with people permanently settling to farm (reduces death from excessive labor and travel by foot) • Larger food supply available because of trading in agricultural goods
NIC’s- Stage 2 & 1/2ish • Newly Industrialized Countries • Ex. Brazil, Mexico, India • You see recent changes from agricultural economy of stage 2 to a manufacturing based economy in stage 3 • Rapid population growth- part where birth and death are furthest apart • Rapidly increasing rate of urbanization
Remember: it’s a theoretical model and not all countries fit the model • Ex. China is an NIC, but due to its one-child policy, appears far more advanced, compared to other NIC’s
Stage 3 • industrialized or manufacturing based economies • Birth rates decrease, death rates decrease and level off
Birth Rates in Stage 3 • Decrease due to effects of urbanization • As families move to cities they have less time, less need and most importantly less space for children • Access to health care increases & leads to family planning, contraceptives • Female employment • Education of women
Death Rates in Stage 3 • Access to health care & nutrition continues to increase life expectancy, which decreases the death rate • But eventually death rates bottom out. Why? • We are all going to die… at some point you just cant stop people from dying. • Life expectancies can go up more later in stage 4, but death rate stays about the same
Stage 4 • In stage 4, birth and death rates come back together to result in limited population growth and sometimes even decline • Here we find our First World countries, they are now “industrialized” • But, keep in mind most of these economies are moving toward service industry economies • Highly urbanized countries with long life expectancies
Birth Rates • Birth rates bottom out • Roles of women have changed • Women are heavily engaged in business, social & political activities and are far less likely to have kids • Low fecundity (- state of being fertile) • DINKS- double income no kids
Death Rates • Still Low!
Stage 5? • The original Demographic Transition model has just four stages; however, some theorists consider that a fifth stage is needed to represent countries that have sub-replacement fertility (that is, below 2.1 children per woman). • Most European and many East Asian countries now have higher death rates than birth rates.