Download

1 / 22
220 likes | 624 Views
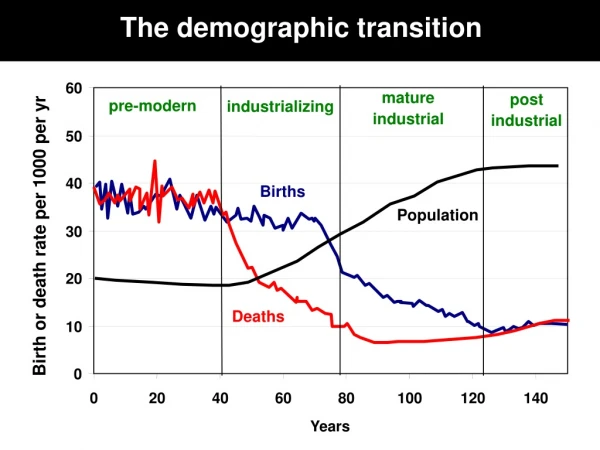
Demographic Transition. Graphic Representations for Demography. Demographic Transition. The historic to the current birth and death rates of a country are plotted on a graph, Indicates the stage of development and rate of natural increase. 1. 2. 3. 4. 5. The Phases and what they mean.

E N D
Demographic Transition Graphic Representations for Demography
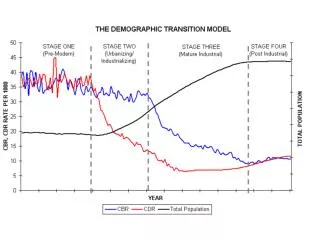
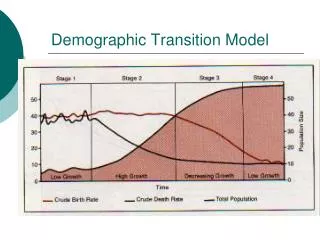
Demographic Transition • The historic to the current birth and death rates of a country are plotted on a graph, • Indicates the stage of development and rate of natural increase.
1 2 3 4 5
Phase 1 • BR and DR are high (>40/1000) BR > DR, • Natural increase is low, population grows slowly.
Phase 2 • DR decline: DR < 45, > 22 • BR steady, no decline > 40/1000 • Natural increase gap becomes larger and population growth becomes rapid.
Phase 3 • BR begins to decline: BR < 42, > 20 • Natural Increase gap starts to narrow and population growth rate begins to slow.
Phase 4 • Begins when BR becomes close to DR • BR <22, DR < 20 • Ends when BR = DR • Natural increase rate become small and the population growth is slow. • Austria, Bulgaria, Germany, Italy and South Korea are near the end of phase 4 or on the boundary.
Phase 5 • DR > BR • Natural Increase rate is inverted (negative) • Population is declining • Denmark and Hungary are in Phase 5.
In General • Time for a country to pass through the demographic transition determines the size to the phase 4 population; • Long period of time in phases 2 and 3 results in a larger population • Length of time in phase 2, largest impact on the size of the population in phase 4. • Population momentum: (momentum of Growth) Built in tendency of a population to grow, despite a declining birth rate. This happens when a significant % of the population is pre-reproductive and will be having children in 15 - 20 years. Happens in countries with exponential growth.
1 2 3 4
1 2 3
An Excellent background article: • Demographic transition • From Wikipedia, the free encyclopedia
Homework • Stat Lab, page 81 – 2 • Only answer questions 1 and 2
1 ( a) • Graphs all have similar shapes
1 (c), (d) • 1950s was a period with similar pulses, • Depression reduced birth rates, 1 (c) 1 (d)
1(e) • 1950 – 1960 The Baby Boom period • After the Second World War came a time of increased prosperity following years of war and depression. For this reason birth rates increased rapidly in most countries • The slight increase in death rates results from an aging population. If the median age is higher, more people on average will die each year.
2 (a) • The country seemed very wealthy because the average income was one million dollars per capita. However, half the population died of hunger. It was later discovered that there were only two people on the island – a servant with no income and a rich person with an income of $2,000,000. Statistics can misrepresent the true wealth of residents.
2 (b) • The statistics gave the impression that all people were well-off; where as, in actual fact, only one of the residents was wealthy.
2 (c) • One way is the use of rates or percentages over actual numbers . For example: • The US only provides 0.3% of its GNP for aid but this is still more than any other country, • “The 9.6 million millionaire “households” in the US own 34% of the global wealth. (Boston Consulting Group)”