Download
1 / 8
80 likes | 82 Views
This study examines the measurement of biomass burning aerosol using the Aerodyne Q-AMS instrument during the DABEX and DODO campaigns. The main result is the CO plot, which shows the relationship between distance from the source and scatterplots of all data. Inorganic mass fraction is compared to anthropogenic pollution. Similar trends observed in the Po Valley and UK pollution suggest aging of the aerosol. Ongoing work includes comparing AMS size distributions with PCASP and investigating photochemistry and presence of SOA in biomass burning layers.

E N D
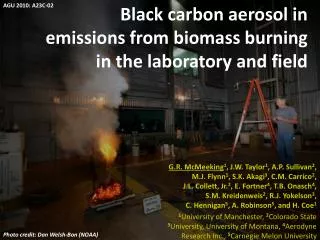
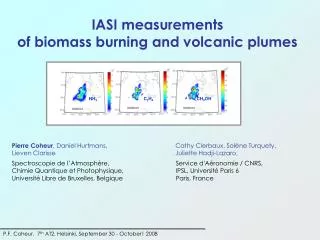
Measurement of biomass burning aerosol with an Aerodyne Q-AMS during DABEX (and DODO) Gerard Capes, Hugh Coe, Paul Williams
AMS main result: the CO plot Increasing distance from source (N and W) moves along the curve Scatterplots of all data from all flights DABEX & DODO1 Inorganic mass fraction is insignificant in comparison
Contrast with anthropogenic pollution European polluted environment Data from the Po Valley in northern Italy (ADRIEX) shows an increase in the Organic to CO ratio as the aerosol ages. A similar trend has been observed for UK pollution during photochemical outbreaks (AMPEP experiment).
Does anything else follow the CO plot? Scattering coefficients change over the plot – do the optical properties (SSA) of the aerosol change over time? Total number concentration suggests this is just dilution, i.e. not losing particles to coagulation: any coagulation has likely already occurred before FAAM measured it
PCASP size distributions as function of CO B158 B162 B166 The shape of the distribution doesn’t correlate strongly with the CO concentration – also points to dilution
Mass spectra – key fragments • m/z43Both saturated (C3H7+ ) and oxidised compounds (aldedhydes and ketones CH2CHO+ CH3CO+) • m/z44 CO2+ Oxidised compounds • m/z57 C4H9+ Saturated hydrocarbons (fresh aerosol) • m/z60Levoglucosan marker Rami Alfarra, PSI
Ageing of the aerosol: changes in chemical functionality 43 44 57 60 44 43 57 60 44 43 57 60
Ongoing work… • Compare AMS size distributions from SLRs with PCASP to derive relationship between vol and mass distribution – hence get a check on effective density and real part of refractive index • Any evidence for photochemistry? Check whether chemical changes correlate with ozone formation • Why do we not see SOA in BB layers? • Collaborative work with climate models