Download
1 / 14
140 likes | 147 Views
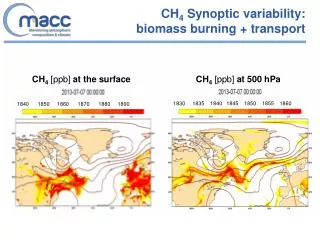
Aircraft observations of Biomass burning aerosol. Ben Johnson, Simon Osborne & Jim Haywood AMMA SOP0 Meeting, Exeter, 15 th May 2007. DABEX – Aircraft obs of BB aerosol. Aircraft Run locations. MODIS Fire counts 13 th Jan – 3 rd Feb, 2006. Mixing with mineral dust. Smoke plume.

E N D
Aircraft observations of Biomass burning aerosol Ben Johnson, Simon Osborne &Jim Haywood AMMA SOP0 Meeting, Exeter, 15th May 2007
DABEX – Aircraft obs of BB aerosol Aircraft Run locations MODIS Fire counts 13th Jan – 3rd Feb, 2006
Mixing with mineral dust Smoke plume Fresh smoke plumes • Smoke plumes: Aerosol concentration > 5000 cm-3
Absorption of solar radiation Biomass aerosol Dust Not absorbing Aircraft mean dust Aircraft Mean BB Highly absorbing
--------0.45 mm ----------0.55 mm ----------0.70 mm Nephelometer wavelengths Biomass aerosol BB aerosol Mixture Dust Dust Vertical distribution BB aerosol Dust
Aerosol optical properties (@ 550nm) from Mie theory ndust= 1.53 + 0.0004i, ρdust = 2.65 g cm-3,nBB= 1.54 + 0.035i,ρBB = 1.35 g cm-3
Aerosol direct radiative forcing (Solar only) TOA forcing close to zero !! “hides” large surface and atmospheric changes. • Edward & Slingo (1996) 2-stream radiation model with 220 bands. • Surface albedo = 0.28. • Solar parameters based on January 15th and latitude of 13.5N (Niamey).
Comparison with remote sensing data? MISR Aerosol optical depth AERONET/PHOTONS sunphotometers: AOD, size distribution, absorption, angstrom. MODIS Aerosol optical depth
Remote sensing vs aircraft:Optical depth MISR MODIS Not too bad, but only 4 data points! Good mean value but underestimates high AODs
Summary • Biomass-burning aerosol had very high SW absorption (x2 SAFARI), whereas dust was virtually non-absorbing. • Huge variation in size distributions and optical parameters, due to variable proportions of dust and biomass aerosol.
Collaborations / comparisons • More independent estimates of single-scattering albedo. • Obs of size distributions, optical and chemical properties and mixing state. • Radiative effect / forcing of aerosols. • Lidar vertical profiles – aircraft nephelometer
(a) (b) Back trajectories from Niamey Origin of low-level dust at 0.5km Origin of BB aerosol at 3km
Remote sensing vs aircraft:Optical depth Aircraft Aircraft uses profile of Neph+PSAP AERONET slightly lower than aircraft or Microtops Simon Osborne