Download
1 / 118
1.18k likes | 1.19k Views
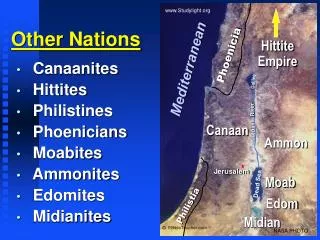
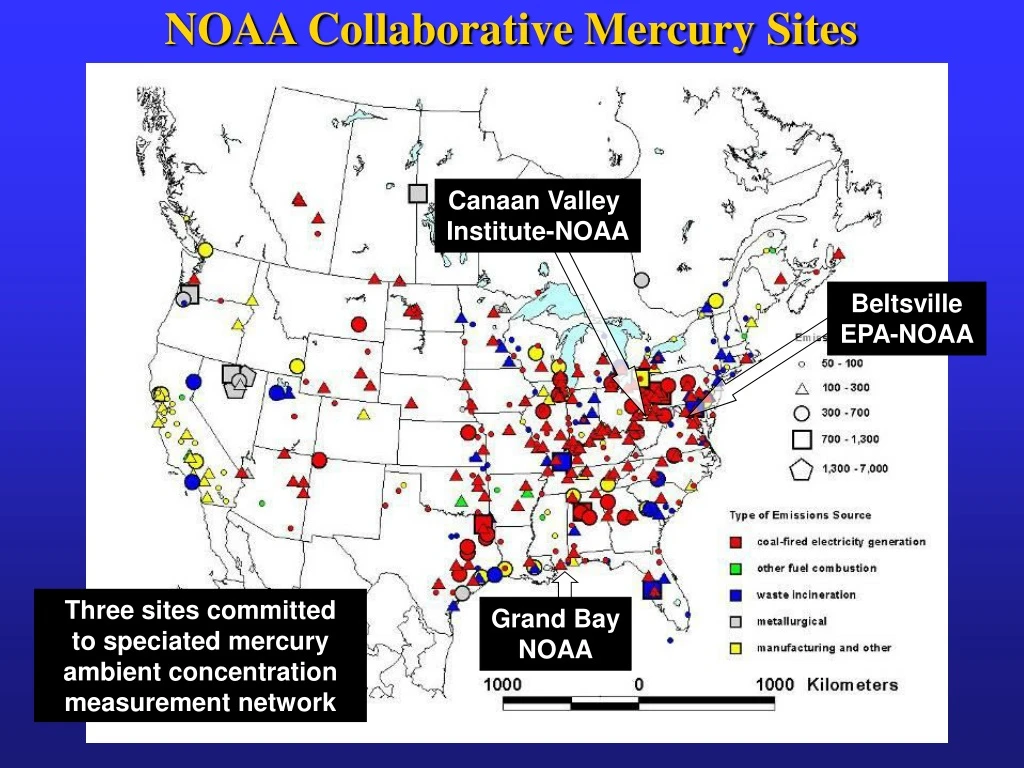
Three sites committed to speciated mercury ambient concentration measurement network. Monitoring sites include AQS, NADP/MDN, and CASTNet. Symbol color indicates type of mercury source, while symbol size and shape indicate 1999 mercury emissions.

E N D
NOAA Collaborative Mercury Sites Canaan Valley Institute-NOAA Beltsville EPA-NOAA Three sites committed to speciated mercury ambient concentration measurement network Grand Bay NOAA
Monitoring sites rural AQS other AQS NADP/MDN CASTNet Symbol color indicates type of mercury source Hg site IMPROVE coal incinerator metals manuf/other Symbol size and shape indicates 1999 mercury emissions, kg/yr 1 - 50 50 - 100 100 - 200 200 – 400 400 - 700 700 – 1000 > 1000 Beltsville, MD CASTNet Site Harford County MSW Incin Brandon Shores and H.A. Wagner 100 miles from DC Montgomery County MSW Incin Eddystone Dickerson Arlington - Pentagon MSW Incin Possum Point Beltsville monitoring site Chalk Point Morgantown Bremo
Beltsville monitoring site Brandon Shores H. A. Wagner Dickerson Brandon Shores Morgantown Chalk Point Morgantown Chalk Point Dickerson H.A. Wagner Coal-fired power plants in MD, VA, PA, and DE with the largest projected differences between 2010 base and 2010 Clean Air Interstate Rule (CAIR) emissions
Status of Atmospheric Measurements at Beltsville, MD CASTNet Site
Tekran Speciation System • Installed System 1 (NOAA) Nov. 7, 2006 • Height of Inlet: 3.75 m above ground • 0.5 m above trailer • Installed second system • (System 2-NOAA) Jan 26, 2007 • System 1 removed April 27, 2007 • Install System 3 (EPA) June 1, 2007 • Remove System 2 August 17, 2007
NOV 2006 DEC JAN 2007 FEB MAR APR MAY JUN JUL AUG SEP OCT System 1 System 2 System 3 Tekran Deployment Timeline -Beltsville
NOY 80 ppb 60 40 Site is influenced by vehicular traffic in Washington Metropolitan area, particularly pronounced during the morning rush hour. Higher boundary layer in the afternoon/evening dilutes vehicular emissions.
CO 200 400 600 ppb Concentrations of CO at the site also reflect the impact of vehicular emissions, but the efficacy of emission controls in the past decade have reduced the strength of this signal.
SO2 40 ppb 30 20 10 Site is also influenced by point-source emitters in the region. Higher concentrations in Fall and Winter reflect lower boundary layer heights, slower conversion of SO2 to SO42-
Photochemical ozone generation in the Spring and Summer leads to elevated concentrations in mid-day. Note the later time of boundary layer breakup in Fall and Winter, as evidenced by later onset of daytime increase.
Elemental Mercury (Hg0) at Beltsville 1 2 3 4 ng m-3 As expected, Hg0 at Beltsville shows no diurnal pattern, little dependence on WD, consistent with a long-lived, ubiquitous, and well mixed trace species. Note that emission source regions match those for SO2, NOY, CO
Particulate Mercury (Hg-P) Little diurnal variation in Hg-P concentrations, with some evidence of entrainment of higher concentrations aloft beginning in the morning, after the breakup of the nocturnal inversion. Spikes due to influence of a few high-concentration events.
Particulate Mercury (Hg-P) 50 100 150 200 All Data Hg-P concentrations are highest during NE flow, consistent with the distribution of local/regional sources. Concentrations show some association with SO2, especially in Winter. Power plants emit little Hg-P. Winter
RGM RGM concentrations generally < 20 pg m-3, with more frequent peaks in concentration than was seen for Hg-P
Reactive Gaseous Mercury (RGM) More pronounced diurnal variation in RGM concentrations, again showing evidence of entrainment of higher concentrations aloft with the breakup of the nocturnal inversion. Large seasonal differences may point to secondary (photochemical) source of RGM as well.
Beltsville Spring All Data Spring increasing air mass age Association of high RGM with high O3 and aged air masses (low NO/NOY ratios) suggests that secondary production of RGM may be occurring. However, high concentrations of RGM may arise from primary emissions from sources a few hours away – and the air masses are somewhat aged on arrival at the site.
50 100 150 200 pg m-3 Reactive Gaseous Mercury (RGM) Directionality of [RGM] shows lobes to the SW and NE, coincident with known local sources of mercury and other primary trace species. RGM is most closely associated with SO2 at Beltsville (Summer) suggesting that point-source emissions also play an important role in influencing RGM concentrations at the site Summer
Monitoring Site NOAA SEARCH USGS UWF/FSU MDN type of mercury emissions source coal-fired power plant waste incinerator manufacturing total atmospheric mercury emissions (kg/yr, 1999 EPA NEI) metallurgical other fuel combustion 1 – 50 50 - 100 100 - 200 200 - 400 Mississippi Alabama Grand Bay NERR Site Barry MS 22 paper manuf paper manuf AL02 Pascagoula MSW incin Mobile Molino Crist Victor J. Daniel Holcim Cement Pace OLF haz waste incin Ellyson AL24 Weeks Bay Mobile Bay Jack Watson Pascagoula NOAA Grand Bay NERR Hg site
Status of Atmospheric Measurements at Grand Bay NERR, Mississippi Type of Measurement: A = concentration in ambient air B = concentration in precipitation C = meteorological parameter 4 m sampling height * to be established
Elemental Mercury (Hg0) at Grand Bay As expected, with a few exceptions Hg0 concentrations show little or no diurnal variation or dependence on wind direction
Overnight Event Feb. 28-March 1 Strong correlation between Hg0 and CO, O3. Suggests combustion (natural sources?) and transport from source regions to West. RGM, Hg-P ca 20 pg m-3 during episode
Particulate Mercury (Hg-P) All Data All Data With the exception of a few well-defined transport events, Hg-P displays no consistent relationship with wind direction, and exhibits little or no correlation with other trace species
All Data Strongest correlations seen between RGM and O3, most of which is driven by seasonal dependence –RGM concentrations are highest, relationship with O3 is strongest in Spring. Spring
Spring Association of peak RGM with low RH and CO concentrations typical of continental influence suggests highest Spring peaks of RGM are seen in post-frontal activity, with transport from upwind continental sources to the North. What is the role of downward mixing of upper-tropospheric air, which contains elevated RGM, O3, and lower CO and RH ? Spring
Weaker RGM – SO2 correlation at Grand Bay than at Beltsville suggests: • A mix of primary sources with varying emission characteristics • A mix of primary and secondary sources of RGM • Different chemical processing and removal rates of SO2 and RGM during transport • Lack of correlation –RGM and Hg-P suggests different • sources and/or removal rates • of these species Spring All Data
As at Beltsville, significant diurnal patterns seen in RGM, but amplitude of diurnal Hg-P profile is much smaller. Highest RGM and Hg-P concentrations seen in Spring. At Beltsville, Hg-P peaks in the winter, and Spring-Summer differences between RGM and Hg-P are small
Similarity to O3 and SO2 diurnal profiles confirms the importance of downward mixing in the development of the daytime boundary layer, but photochemical (secondary) production of RGM is also possible
Summary and Conclusions – Interpretation of Ambient Measurements • Beltsville site is semi-urban and is ringed by emission sources of mercury and other primary trace species, with frequent peaks in RGM (less for Hg-P) concentrations due to transport from nearby sources. Grand Bay NERR Site exhibits characteristics of a rural/remote site with low concentrations of all species but occasional transport related episodes of higher concentrations. • At both sites, RGM exhibits a more pronounced diurnal profile than Hg-P, but both profiles are coincident with O3 and SO2 peaks, suggesting downward mixing of an aloft reservoir upon the breakup of the nocturnal boundary layer. In situ production of RGM may also be contributing. RGM peaks in the Spring at Grand Bay, in Spring and Summer at Beltsville. Hg-P is higher in Winter at Beltsville. • At Beltsville, RGM correlates most closely with SO2 in Summer, suggesting the dominance of nearby (primary) emissions. However, RGM is also associated with elevated O3 and low NO/NOy ratios, suggesting that secondary production may also be important
Summary and Conclusions – Interpretation of Ambient Measurements (continued....) • At Grand Bay, RGM is associated with O3 in Springtime, and is associated with dryer air characteristic of continental emissions (CO ca 200 ppb). • These results suggest RGM is transported from northerly continental sources following cold-frontal penetration in Spring. Reduced frequency of cold frontal passage at the site in Summer leads to lower RGM levels, more sporadic transport to the site from upwind sources.
Preliminary Deposition Estimates -Beltsville RGM + Hg-P Dry Deposition (ng m-2 day-1); assumes Vd = 2.5 cm s-1 and 0.3 cm s-1 mid day average Fluxes (ng m-2 day-1) Fall Winter Spring Summer Dry Dep, Beltsville (2006-2007) 7.8 22.3 18.2 Wet Dep, Beltsville (2005-2006) 35.413.9 13.0 54.8
Preliminary Deposition Estimates -Grand Bay RGM + Hg-P Dry Deposition (ng m-2 day-1); assumes Vd = 2.5 cm s-1 and 0.3 cm s-1 mid day average Fluxes (ng m-2 day-1) Fall Winter Spring Summer Dry Dep, Grand Bay (2006-2007) 5.4 4.3 14.2 8.6 Wet Dep, AL24 (2005-2006) 13.5 24.8 31.6 34.6 Wet Dep, MS22 (2005-2006) 11.9 28.2 28.5 65.3 Wet Dep, AL02 (2005-2006) 24.7 21.6 31.3 34.6
Summary and Conclusions - Deposition • Preliminary estimates of dry deposition have been made based on measured RGM and Hg-P concentrations. More sophisticated estimates will be made in the future. • Dry deposition estimates, when compared with nearby MDN deposition records, suggest that dry deposition sometimes dominates at the Beltsville site, depending on season. • At Grand Bay, wet deposition dominates the removal of reactive mercury species, especially in Winter. • If substantial Hg exists in the coarse aerosol fraction, however, the reported dry deposition fluxes are under-estimated.
Trajectory Analysis Examples: Beltsville