Download
1 / 22
220 likes | 315 Views
EXPLORING LINKAGES BETWEEN PLANT-AVAILABLE SOIL MOISTURE, VEGETATION PHENOLOGY AND CONVECTIVE INITIATION By Julian Brimelow and John Hanesiak.

E N D
EXPLORING LINKAGES BETWEEN PLANT-AVAILABLE SOIL MOISTURE, VEGETATION PHENOLOGY AND CONVECTIVE INITIATION By Julian Brimelow and John Hanesiak
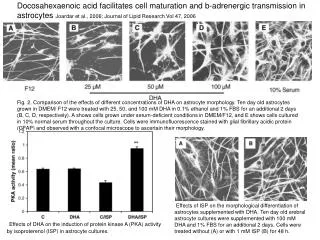
“The sensitivity of the synoptically forced convection to soil and vegetative processes including transpiration indicates that detailed representation of land surface processes should be included in weather forecasting models, particularly for severe storm forecasting where local-scale information is important”. Holt et al. (2006)
SCIENCE QUESTIONS UNSTABLE 2008: Theme II 2.1) Is there a noticeable difference in storm initiation between wet and dry areas over the cropped region? 2.2) Is there a noticeable gradient of surface and boundary layer water vapour across the major wet/dry areas, and how do these evolve? 2.3) Are mesoscale circulations detectable in the vicinity of boundaries between wet and dry areas? If so, how do they influence storm initiation?
HYPOTHESIS “Modification of the local thermodynamics, causing changes in the LCL, and CAPE,…can have important consequences regarding the location and timing of convection initiation” Georgescu et al. (2003)
Sensitivity of convection to near surface T and q MSE = gz + CpT + Lq Must increase T by ~2.5 °C to increase MSE by same amount as 1°C increase in q • CAPE is very sensitive to Δq CIN, however, sensitive to surface ΔT Crook (1996)
PRIMARY CAUSES OF LAND-ATMOSPHERE FEEDBACKS • Soil moisture • Vegetation • Orography • Land use
SOIL MOISTURE “The role of soil moisture in ABL development involves a complex interaction of surface and atmospheric processes”. Ek and Holtslag (2003)
Findell and Eltahir (2003): The propensity of the atmosphere to support convection is not only dependent on the surface and energy budgets, but also on the structure of the low-level temperature and moisture profiles in the early morning.
Energy Balance: Crop vs. Bare Ground Energy Balance: Crop vs. Forest
VEGETATION Strong and Smith (2001)
UNSTABLE PROJECT AREA Calgary
TOOLS Mobile Atmospheric Research System (MARS)
METHODOLOGY • STEP 1: • Document the spatial and temporal evolution of the plant-available moisture in the root zone (PAW) using crop model and in-situ obs • Document the spatial and temporal evolution of the NDVI • Create an inventory of wet vs. dry areas, and tight PAW/NDVI gradients • STEP 2: • For each day, classify synoptic-scale forcing as weak, moderate or strong • For each day, characterize structure of the boundary layer in morning • STEP 3: • Use mesonet, mobile mesonet, MARS, Doppler radar and aircraft data to create an inventory of mesoscale boundaries • Use high resolution VIS satellite images to create archive of those boundaries associated with deep, moist convection • Determine whether boundaries are associated with gradients in PAW
STEP 4: • Quantify CG flash density over wet vs. dry areas, and near PAW gradients • Use radar data to document storm intensity over wet and dry areas • Use radar data to document any changes in storm structure and intensity when transitioning from wet to dry PAW and vice versa • STEP 5: • Document cloud base height (from celiometer) over wet and dry areas • Compare with cloud-base height derived using sfc. and mixed-layer parcels • STEP 6: • Search for correlations between PAW and NDVI and observed lightning flash density • Search for correlations between PAW and NDVI and storm strength as determined from radar data • Search for possible connections between storm initiation zones and gradients between wet and dry PAW
Breakout Session (Theme 2) Participants • Daniel ? (AB Ag) • Craig Smith (CRB) • Gary Burke (HAL) • Ron Stewart (McGill) • Julian Brimelow (UofM) • John Hanesiak (UofM)
Summary of Breakout Session Refinement of UNSTABLE questions Concerns about Question d. Can we realistically achieve this? Need to contact experts in the field. If not willing to do that then should let go. Do some preliminary follow up to see whether obtaining EC towers and people to process and analyze data is realistic?
Identify of who plans to be directly involved in UNSTABLE field campaign and how • Alberta Agriculture: Not directly involved with field operations, but willing to offer data from network of stations, as well as QC of data from stations Ag stations that use GOES platform available in real time • Craig Smith, CRD: Provide FOPEX data, two upper-air systems and 50 sondes, student/s, Mobile GPS sensor • HAL: Funding, students from Saskatoon & Winnipeg (two perhaps), HAL staff willing to participate with field program. Could also perhaps arrange four students from Edmonton office
Data requirements, instrumentation and deployment strategies • Conduct observations as stated in Theme 2 for each sub-question • Need to arrange for crop model to be run in real time from 1 April using as many stations as possible • In-situ soil moisture measurements from AB Ag stations • Satellite-- NDVI, SM and other surface anomalies • Integrate wide variety of data sets, data QC and management critical • Make stronger link between DRI and UNSTABLE, natural fit, ET working group & water cycle
Champions for Data Analysis Page 11 • (a), (b) & maybe (c) - Brimelow • (d) & (e) - Hanesiak et al • (f) - Strong?
Funding strategies and opportunities for in-kind support • NSERC-- Collaborative research and development fund (CRDF) to pay for students and post docs • NSERC 50% ; industry 50% (50% in-kind ; 50% cash) • Alberta Financial Services • Insurance Bureau of Canada • WMI can provide significant in-kind contributions • May want some kind of evolution component (of thunderstorms) of the science plan. Have to be careful how we present UNSTABLE to them (heavy precip slant?) - Ralph Wright • Timeline would need attention now


![Koepke et al., [1997] Kaufman and Tanre [1997] Levy et al., [2004] Remer et al., [2006]](https://cdn2.slideserve.com/3945504/slide1-dt.jpg)