Download
1 / 51
510 likes | 526 Views
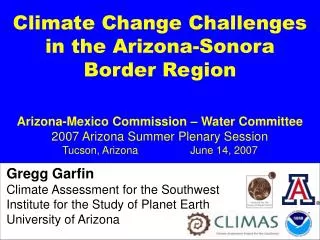
Climate Variability and Climate Change in the U.S.-Mexico Border Region Upper San Pedro Partnership Technical Committee Meeting Cochise College – Sierra Vista, Arizona – July 26, 2007. Gregg Garfin Climate Assessment for the Southwest Institute for the Study of Planet Earth

E N D
Climate Variability and Climate Change in the U.S.-Mexico Border Region Upper San Pedro Partnership Technical Committee Meeting Cochise College – Sierra Vista, Arizona – July 26, 2007 Gregg Garfin Climate Assessment for the Southwest Institute for the Study of Planet Earth University of Arizona
H Atmospheric Circulation: Winter Mike Crimmins, University of Arizona
Atmospheric Moisture: Winter MOIST DRY Mike Crimmins, University of Arizona
H Atmospheric Circulation: Winter Mike Crimmins, University of Arizona
H Atmospheric Circulation: Summer Bermuda High Mike Crimmins, University of Arizona
Atmospheric Moisture: Summer DRY MOIST Mike Crimmins, University of Arizona
Persistent Circulation Influences on Western US ° 90 N ° 75 N Atlantic Multidecadal Oscillation ° Pacific Decadal Oscillation 60 N ° 45 N ° 30 N ° 15 N El Niño Southern Oscillation ° 0 ° 15 S ° 30 S ° ° ° ° ° ° ° ° ° ° ° 90 E 120 E 150 E 180 W 150 W 120 W 90 W 60 W 30 W 0 30 E Slide courtesy of Julio Betancourt, USGS
~ ~ cool warm warm cool El Niño-Southern Oscillation (ENSO) • Redistribute energy, moisture • Persistent changes: Duration 1-3 years • Recur every 2-7 years Slide courtesy of Greg McCabe, USGS
El Niño: Winter Effects U.S. • Increased ephemeral channel recharge Source: NOAA Climate Prediction Center http://www.cpc.ncep.noaa.gov/products/analysis_monitoring/ensocycle/winter25%25.gif
La Niña: Winter Effects U.S. • Drought circulation pattern Source: NOAA Climate Prediction Center http://www.cpc.ncep.noaa.gov/products/analysis_monitoring/ensocycle/winter25%25.gif
Climate Division 7 Southeastern Arizona 1895-2002
Pacific Decadal Variability • Discovered in 1990s • Occurs every 20-30 years • Mechanism likely • ENSO • Kuroshio Current • Aleutian Low Courtesy of N. Mantua – University of Washington Mantua et al., 1997 Bulletin of the American Meteorological Society
Negative PDO Positive PDO 84 117 91 113 82 131 87 115 79 78 123 119 78 120 AZ PDO (Oct.-Sept.) Precipitation % Average Based on Maxwell and Holbrook, NWS Tucson
http://www.ncdc.noaa.gov/oa/climate/research/teleconnect/teleconnect.htmlhttp://www.ncdc.noaa.gov/oa/climate/research/teleconnect/teleconnect.html
Shift to Low Index? http://www.ncdc.noaa.gov/oa/climate/research/teleconnect/teleconnect.html
Positive AMO Phase • West: Warm, dry, high pressure • Associated with 1950s and late-1500s droughts Atlantic Multidecadal Oscillation - AMO Slide courtesy of Greg McCabe, USGS
Drought Frequency % (25 = expected) . high drought frequency low drought frequency Pacific negative + Atlantic positive . McCabe et al., 2004 Proceedings of the National Academy of Sciences
Global Energy Balance From http://www.bom.gov.au
380 280 Most rapid change in the last 10,000 years CO2 Changes http://www.grida.no/climate/vital/02.htm
http://lwf.ncdc.noaa.gov/oa/climate/research/anomalies/anomalies.htmlhttp://lwf.ncdc.noaa.gov/oa/climate/research/anomalies/anomalies.html
Cochise County June-May Temperature Western Regional Climate Center
Cochise County June-May Precipitation Western Regional Climate Center
Trends in Nov-Mar Snowfall Fraction More Rain, Less Snow More Snow, Less Rain Courtesy of Noah Knowles, USGS
Dramatic Warming Episodes Losses of 30-60%
GCM • Models, based on physics • Atmosphere, ocean • Some processes must be estimated, scaled to large regions • Processes tuned and validated using historical data • Models driven by forcing factors • Solar, volcanic, GHGs, aerosols (particles)
Scenario descriptions IPCC 3rd Assessment Report
Annual Temperature: End of 21st Century IPCC 4th Assessment: Working Group I, Chapter 11, Regional Projections
Annual Precipitation: End of 21st Century IPCC 4th Assessment: Working Group I, Chapter 11, Regional Projections
H Atmospheric Circulation: Winter
H Atmospheric Circulation: Winter
Heat Waves Increased Length of Average Heat Wave (days) 4 models and A2 “Business as Usual” emissions scenarios in a Regional Climate Model 2071-2095 Minus 1961-1985 Diffenbaugh et al., 2005 Proceedings of the National Academy of Science
Annual Evapotranspiration A2 Diffenbaugh et al., 2005 Proceedings of the National Academy of Science
Increased Fraction of Extreme Precipitation Diffenbaugh et al., 2005 Proceedings of the National Academy of Science A2
What does global warming have in store for El Niño? • Latest word: Study comparing 20 different climate models • No clear consensus! • Models still do not simulate El Niño well… • “Best” models showed smallest changes More La Niña-like More El Niño-like Collins, 2005, Climate Dynamics
Climate Change Water Challenges in the Arizona-Sonora Border Region • Increased temperatures: very likely • Decreased precipitation: likely • Potential direct impacts and concerns: • Decreased surface water supply reliability • Increased evaporation • Reduced minimum flows for fish • Earlier peak flow timing • Greater likelihood of extreme events: drought, flood
Incorporating Climate Into Streamflow Prediction • Statistical models (PPT, SWE, Streamflow) • Historical data are assumed to be a sample of future events • Ensemble streamflow prediction (ESP) • Conceptual hydrologic models • Soil moisture accounting, Snow model • Current basin initial states • Multiple meteorological inputs • TEM, PPT, Estimated Upstream flow • Probabilistic distribution of future events, daily data aggregated to seasonal water volume
Incorporating Climate Into Streamflow Prediction • Force models with data adjusted for seasonal outlook terciles, or ENSO, PDO, AMO phases • Assumptions • Historical data are representative of future states • Accurate understanding of processes and their sensitivities to climate variations