Download
1 / 15
160 likes | 374 Views
Learning curve. As firms gain experience in production of a commodity or service, their average cost of production usually declines

E N D
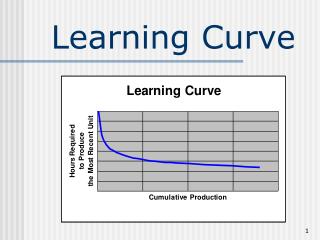
Learning curve • As firms gain experience in production of a commodity or service, their average cost of production usually declines • For a given level of out put per time period, the increasing cumulative total output over many time periods often provides the manufacturing experience that enables firms to lower their average cost of production • The learning curve shows the decline in the average input cost of production with rising cumulative total output overtime
Learning curve (cont…) • For example it might take 1000 hours to assemble the 100th aircraft, but only 700 hours to assemble the 200th aircraft • Because managers and workers become more efficient as they gain production experience • Figure indicates that average cost declines from about $250 for producing the 100th unit of the product (point F) to about $200 for producing the 200th unit (point G) and to about $165 for the 400th unit (Point H) • Learning curve convex to the origin • Average cost decline when production process become mature
Graphical presentation of learning curve Learning curve F 250 G 200 165 400 200 100
Learning curve (cont…) • Learning curve can be expressed algebraically • C=aQ • Where as C is the average input cost of the Qth unit of output, a is the average cost of the first unit of output and b will be negative because the average input cost declines with increases in cumulative total output • The greater the absolute value of b, the faster the average cost declines b
Cost volume profit analysis • In this section we examine cost –volume-profit analysis (often called breakeven analysis) • These simple analytical technique is used in managerial decision making and can be quite useful when applied under the proper set of circumstances • Cost -volume - profit analysis • Cost- volume-profit or breakeven analysis examines the relationship among the total revenue, total cost, and total profit of the firm at various level of output • Cost- volume-profit or breakeven analysis is often used by business executives to determine the sales volume
Cost volume profit analysis (cont…) Required for firm to break even • The analysis uses a cost-volume-profit chart in which the total revenue and the total cost cures are represented by straight lines • In figure TR and TC are plotted on vertical axis and level of output is on horizontal axis • The slope of TR curve refers to the constant price of $10 per unit at which the firm can sell its output • The TC curve indicates total fixed cost of $200 (the vertical intercept) and a constant average variable cost of $5
Cost volume profit analysis (cont…) TR Profit TC B $400 Loss TFC=$200 $200 40
Cost volume profit analysis (cont…) • Point “B” is break even point, where TR=TC = $400 ,output is 40 unit • The firm faces losses at smaller output and earns profits at higher level of output • The breakeven chart is flexible tool to quickly analysis the effect of changing conditions on the firm • The cost-volume-profit analysis can performed algebraically • As we know that TR=P.Q • TC=TFC+AVC.Q or TC=TFC+TVC
Cost volume profit analysis (cont…) • At breakeven point at point “B” TR=TC • ………………………….. P.QB=TFC+AVC.QB • Solving for breakeven output , QB ,we get • P.QB-(AVC)QB=TFC • QB(P-AVC)=TFC • QB=TFC/(P-AVC)
Cost volume profit analysis (cont…) • With TFC=$200 and P=$10 and AVC=$5 • Putting these values in formula • QB=TFC/(P-AVC) we get 40 • In formula the denominator i.e. P-ACV is called contribution margin per unit • Sometime a firm wishes to get a specific profit and wants to estimate the particular level of output ,so this analysis is used for determine the target output at which a target profit can be achived
Cost volume profit analysis (cont…) • To do so we simply add πT to the numerator • QB=TFC+ πT/(P-AVC) • QT =$200+$100/$10-$5=$300/$5=60 • So if the firm produces 60 unit it can achieve the profit$100 • We can verify it by the profit formula • Π=TR-TC, P.Q-TFC+AVC.Q • TR=$10.60=$600 • TC=$200+$5.60=$500 • Π=$600-$500=100
Operating leverage • Operating leverage refers to the ratio of the firm’s total fixed costs to the total variable costs • The higher is this ratio, the more leveraged the firm is said to be • As the firm becomes more automated or more leveraged (i.e. substitute fixed costs for variable costs) • Its total fixed costs rise but its average variable costs fall • The breakeven output of the firm increase
Operating leverage (cont..) TR TC2 Profit TC B $400 Loss 300 TFC=$200 $200 40 45
Operating leverage (cont..) • In fig the intersection of TR and TC defines breakeven output of QB =40,if the firm total fixed cost rise from $200 to $300 ,while average variable costs decline from $5 to $3.33 the breakeven output will rise to QB1 =45 • It shows that the higher is the ratio of the total fixed costs to the total variable costs( the more leveraged the firm is) • The responsiveness or sensitivity of the firm toal profits to a change in its output or sales can be measured by degree of operating leveraged (DOL)
Operating leverage (cont..) • DOL is defined as percentage change in profit divided by percentage change in output • DOL=%Δπ/%ΔQ • DOL =Δπ/π =……… Δπ Q . ΔQ π ΔQ/Q