Download
1 / 16
170 likes | 565 Views
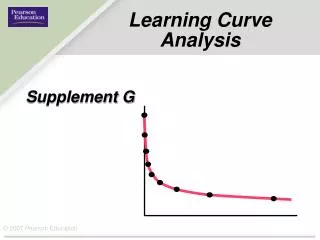
Learning Curve Analysis. Learning Objective. After this class the students should be able to: Calculate the hours required to produce determinate product taking account the learning curve. Time management.

E N D
Learning Objective After this class the students should be able to: Calculate the hours required to produce determinate product taking account the learning curve.
Time management • The expected time to deliver this module is 50 minutes. 30 minutes are reserved for team practices and exercises and 20 minutes for lecture.
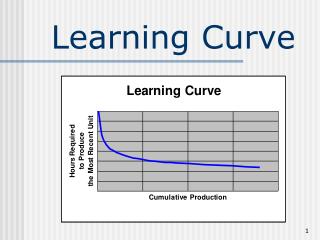
Learning Curve • Past experience indicates that individuals learn by experience (i.e., get better and better at the job by carrying out the tasks more and more).
Warm-up – 30 minutes • The student teams receive a bag containing pieces and are asked to assembly a same set for several times. • One team’s member is invited to chronometer the time that your team spend to assembly the set. • After the end, each team plots the results in a software (excel) and try to fit an exponential curve.
Learning curve This phenomenon was first reported by T. P. Wright in 1936.But, the learning curve theory is based on assumptions such as those listed next Chase, R B., 1981
Learning curve assumptions • The time required to complete a specified task or unit of a product or item will be less each time the task is performed; • The unit time will reduce at a decreasing rate; • The decrease in time will follow a certain pattern, such as negative exponential distribution shape.
Learning Curve assumptions • The learning curve may vary one product to another and from one organization to another. The rate of learning depends on factors such as the quality of management and the potential of the process and products
Moreover, it may be said that any change in personnel, process, or product disrupts the learning curve. Consequently, there is a need for the utmost care in assuming that a learning curve is continual and permanent.
The Table presents data on learning curve effects in the U.S. industrial sector . An 80% learning rate is descriptive of certain operations in such areas as ship construction, electronic data processing equipment, automatic machine production, and aircraft instruments and frame assemblies. • The learning curves are found to be quite useful in a variety of applications, including strategic evaluation of company and industry performance, internal labor forecasting, establishing costs and budgets, production planning, external purchasing, and subcontracting of items • The learning curve theory is based on a doubling of productivity. More specifically, when output or production doubles, the reduction in time per unit affects the learning curve rate. For example, an 80% learning rate means the second unit takes 80% of the time of the first unit, the fourth unit takes 80% of the second unit, the eighth unit takes 80% of the fourth unit, and so on.
Result • We may write LHm = LH1mC Where: LHm is the labor hours required to produce unit LH1 is the labor hours to produce unit one or the first unit. C is the learning curve slope and is expressed by log of the learning rate/(log2)
Discussion • Each team has to present an analyze of its results based on the theory presented in class
Exercise Assume that the learning rate for a certain operation is 75% and it took 90 hours to produce the first unit. Calculate the hours required to produce the fifth unit.
Solution By substituting the given data value into C equation, we get • C = log 0.75/log 2 = 0.4150 • Using the above value and the specified data in LHm = LH1mC yields • LH5 = 90(5)-0.4150 • = 46.15 hours • It will take 46.15 hours to produce the fifth unit.
Reference • “Engineering and Technology management tools and applications” – Dhillon, B. S. Artec House, Inc 2002. • Operation Analysis Using Excel – Weida, 2000, Duxbury.