Download
1 / 12
120 likes | 233 Views
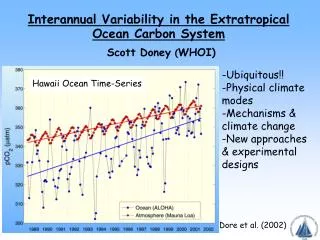
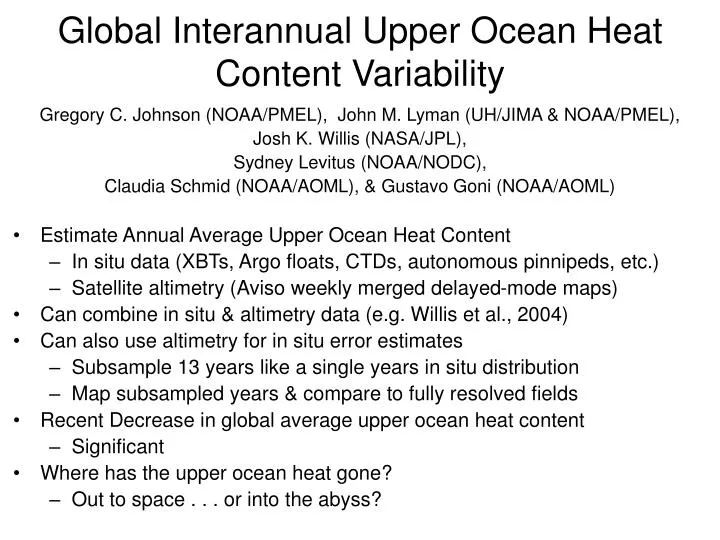
Global Interannual Upper Ocean Heat Content Variability. Gregory C. Johnson (NOAA/PMEL), John M. Lyman (UH/JIMA & NOAA/PMEL), Josh K. Willis (NASA/JPL), Sydney Levitus (NOAA/NODC), Claudia Schmid (NOAA/AOML), & Gustavo Goni (NOAA/AOML) Estimate Annual Average Upper Ocean Heat Content

E N D
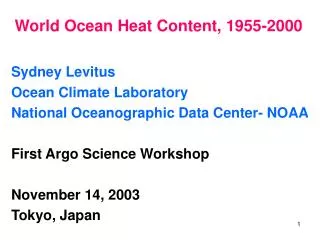
Global Interannual Upper Ocean Heat Content Variability Gregory C. Johnson (NOAA/PMEL), John M. Lyman (UH/JIMA & NOAA/PMEL), Josh K. Willis (NASA/JPL), Sydney Levitus (NOAA/NODC), Claudia Schmid (NOAA/AOML), & Gustavo Goni (NOAA/AOML) • Estimate Annual Average Upper Ocean Heat Content • In situ data (XBTs, Argo floats, CTDs, autonomous pinnipeds, etc.) • Satellite altimetry (Aviso weekly merged delayed-mode maps) • Can combine in situ & altimetry data (e.g. Willis et al., 2004) • Can also use altimetry for in situ error estimates • Subsample 13 years like a single years in situ distribution • Map subsampled years & compare to fully resolved fields • Recent Decrease in global average upper ocean heat content • Significant • Where has the upper ocean heat gone? • Out to space . . . or into the abyss?
2005 Upper Ocean Heat Content • Combined data set • Follow Willis et al. (2004) • In situ thermal data & • Satellite altimetric data • 2005 relative to 1993-2002 -> • Warm subpolar N. Atlantic • Likely NAO • Warm S. Ocean band • Likely SAM • 2005-2004 (Short Time-Scale) -> • Large-amplitude small-scale variations • Ocean advection • Equatorial Pacific cooling • Fading El Niño
Long Time-Scale (13-Year) Linear Trends • Longer time-period -> • Smaller amplitude & larger scale • Big N. Atlantic Change • NAO 1996 shift in winds • Big. N Pacific Change • PDO Large-scale wind shifts • Big. S. Ocean Changes • SAM Large-scale wind shifts • Overall warming trend? • ~ 5% of area at 95% CI • Hmm . . . • Look at global integral . . .
Annual Global Upper OHCA Variations • Decadal increase: • Willis et al. (2004) • Levitus et al. (2005) • What about the recent decrease? • An observing system • change? • Argo went global • in 2004 • Remove floats • (& more) blue • Don’t remove • seasonal cycle red • New error analysis • The cooling remains
Annual Global Upper OHCA Variations • Levitus et al. • Has Different: • Mapping • Quality Control • Data Sets (slightly) • Reference Period • Similar recent cooling World Ocean 0 - 700 m
Use SSHA as upper OHCA proxy • Altimetry gives 13 years of SSHA • For a given year (say 1955) • Use SSHA from 1993-2005 • subsample SSHA like 1955 • Map yearly subsampled SSHA • Difference subsampled & full • Time series -> error estimate • Means of + and - differences • Not exactly the error estimate • Global anomalies biased low • Because no data -> no anomaly • (conservative choice) New Refined Error Analysis
Interannual Error Estimate • Three different regimes • Before the XBT • XBT starts in 1960’s • Number increases • Argo starts in 2000’s • Coverage improved • Note 2002 vs. 2005 • Both years ~ 150,000 profiles • Distributions different • Caveat! 13-years too short • Few ENSO • NAO, PDO, etc. • Most valid from 1993 on
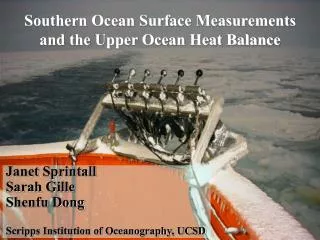
Measure of in situ coverage • Blue good, red bad • 2002 mostly ship tracks & moorings • Little S. Ocean coverage • Will improve with time • NODC collects data • Satellite altimetry (Aviso weekly merged delayed-mode maps) • 2005 mostly float tracks • Even spatial distribution • Even temporal distribution • Few gaps • Ice • EEZs • Shallow Seas Same Profile Numbers, Different Errors
Earlier Downturn in 1980’s • Levitus et al. (2005) OHCA • Big 1980-1983 cooling • New error estimates • Significant • (Note caveat) • Early error bars large • Likely underestimates • After XBT advent • Interannual significance
Ocean Heat Anomaly Distribution? • 1993 to 2003 change (red) • Surface intensified • Approaches 0 by 750 m • Some wiggles with depth • 2003 to 2005 change (blue) • Smaller in amplitude • Surface warming • Mid-depth cooling • Approaching 0 at depth? • 1993 to 2005 change (black) • More surface intensified • Surface warming • Mid-depth cooling • 400-m zero-crossing
Heat in the Deep Ocean • Levitus et al. (2005) • Annual 0-700 m (red) • Pentadal 0-3000 m (gray) • May not be different within uncertainties • Upper Ocean has most variability • What about the abyss?
S. Atlantic Antarctic Bottom Water Warms • 2005 CO2/CLIVAR vs. • 1989 WOCE A16S & C • 1995 WOCE A23 • AABW changes • +0.04 C warming • Bottom 1500 dbar • 95% significant • Global budgets?