Download
1 / 33
330 likes | 336 Views
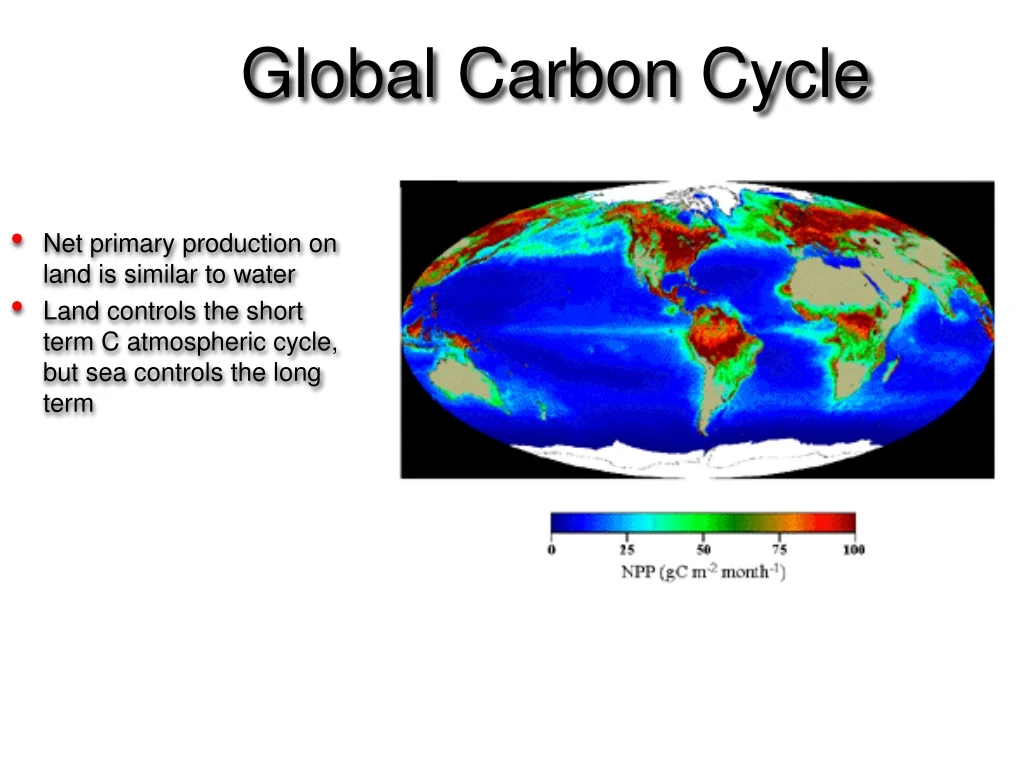
Global Carbon Cycle. Net primary production on land is similar to water Land controls the short term C atmospheric cycle, but sea controls the long term. Inorganic C Cycle. Units. 1 Pg = 1 Petagram = 1x10 15 g = 1 Billion metric tonnes = 1 Gigatonne

E N D
Global Carbon Cycle Net primary production on land is similar to water Land controls the short term C atmospheric cycle, but sea controls the long term
Units • 1 Pg = 1 Petagram = 1x10¹⁵g = 1 Billion metric tonnes = 1 Gigatonne • 1 Tg = 1 Teragram = 1x10¹²g = 1 Million metric tonnes • 1 Kg Carbon (C) = 3.67 Kg Carbon Dioxide (CO2)
Geologic C cycle • C moves from land to sea due to weathering and transport • C in sea can precipitate as CaCO3 and then later return to atmosphere after subduction and subsequent volcanism
CO2 is an important greenhouse gas • Accounts for a significant portion of the greenhouse forcing • Other gases include nitrous oxide (N2O), methane (CH4), chlorofluorocarbons, water vapor
Along comes Man • Over the last 150 years, CO2 concentrations have reached unprecedented levels due to industrialization
Fast and slow processes • Some exchanges in the C cycle are rapid and affect short-term changes in concentration of CO2 • Others are on geologic scales, yet Man has greatly accelerated these, especially fossil fuels
Anthropogenic Global Carbon Dioxide Budget Global Carbon Project 2010
Atmospheric C budget Atmospheric increase Net emissions from change in land use Emissions from fossil fuels Oceanic Uptake Missing Carbon = + - - 3.3 (±0.2) 5.5 (±0.5) 1.6 (±0.7) 2.0 (±0.8) 1.8 (±1.2)
390 388 386 Parts Per Million (ppm) 384 382 380 378 • 1970 – 1979: 1.3 ppm y-1 1980 – 1989: 1.6 ppm y1 • 1990 – 1999: 1.5 ppm y-1 2000 - 2009: 1.9 ppm y-1 2006 2009 2008 2011 2007 2010 Atmospheric CO2 Concentration GLOBAL MONTHLY MEAN CO2 December 2009: 387.2 ppm September 2010 (preliminary): 389.2 ppm 39% above pre-industrial Annual MeanGrowth Rate (ppm y-1) November 2010 2009 1.62 2008 1.80 2007 2.14 2006 1.84 2005 2.39 2004 1.60 2003 2.19 2002 2.40 2001 1.89 2000 1.22 Data Source: Pieter Tans and Thomas Conway, 2010, NOAA/ESRL
Plant growth affects CO2 seasonally Carbon tracker
Global Respiration and Photosynthesis Are (Were) in Balance Along Comes Man to Mess things Up
Atmospheric C budget (Again) Atmospheric increase Net emissions from change in land use Emissions from fossil fuels Oceanic Uptake Missing Carbon = + - - 3.3 (±0.2) 5.5 (±0.5) 1.6 (±0.7) 2.0 (±0.8) 1.8 (±1.2)
2000-2009 (PgC) 10 5 Source deforestation CO2 flux(PgC y-1) 1.1±0.7 5 Sink 10 1950 2000 1900 1850 Time (y) Human Perturbation of the Global Carbon Budget Global Carbon Project 2010; Updated from Le Quéré et al. 2009, Nature Geoscience; Canadell et al. 2007, PNAS
2000-2009 (PgC) 10 fossil fuel emissions 7.7±0.5 5 Source deforestation CO2 flux(PgC y-1) 1.1±0.7 5 Sink 10 1950 2000 1900 1850 Time (y) Human Perturbation of the Global Carbon Budget Global Carbon Project 2010; Updated from Le Quéré et al. 2009, Nature Geoscience; Canadell et al. 2007, PNAS
2000-2009 (PgC) 10 fossil fuel emissions 7.7±0.5 5 Source deforestation CO2 flux(PgC y-1) 1.1±0.7 5 Sink 10 1950 2000 1900 1850 Human Perturbation of the Global Carbon Budget Time (y) Global Carbon Project 2010; Updated from Le Quéré et al. 2009, Nature Geoscience; Canadell et al. 2007, PNAS
2000-2009 (PgC) 10 fossil fuel emissions 7.7±0.5 5 Source deforestation CO2 flux(PgC y-1) 1.1±0.7 atmospheric CO2 4.1±0.1 5 Sink 10 1950 2000 1900 1850 Time (y) Human Perturbation of the Global Carbon Budget Global Carbon Project 2010; Updated from Le Quéré et al. 2009, Nature Geoscience; Canadell et al. 2007, PNAS
2000-2009 (PgC) 10 fossil fuel emissions 7.7±0.5 5 Source deforestation CO2 flux(PgC y-1) 1.1±0.7 atmospheric CO2 4.1±0.1 5 Sink ocean 2.3±0.4 ocean (5 models) 10 1950 2000 1900 1850 Time (y) Human Perturbation of the Global Carbon Budget Global Carbon Project 2010; Updated from Le Quéré et al. 2009, Nature Geoscience; Canadell et al. 2007, PNAS
2000-2009 (PgC) 10 fossil fuel emissions 7.7±0.5 5 Source deforestation CO2 flux(PgC y-1) 1.1±0.7 atmospheric CO2 4.1±0.1 land 5 2.4 (Residual) Sink ocean 2.3±0.4 (5 models) 10 1950 2000 1900 1850 Time (y) Human Perturbation of the Global Carbon Budget Global Carbon Project 2010; Updated from Le Quéré et al. 2009, Nature Geoscience; Canadell et al. 2007, PNAS
1.1±0.7 PgC y-1 4.1±0.1 PgC y-1 47% 2.4 PgC y-1 27% Calculated as the residual of all other flux components + 7.7±0.5 PgC y-1 26% 2.3±0.4 PgC y-1 Average of 5 models Fate of Anthropogenic CO2 Emissions (2000-2009) Global Carbon Project 2010; Updated from Le Quéré et al. 2009, Nature Geoscience; Canadell et al. 2007, PNAS
Sinks for CO2 • Ocean is the primary sink that controls CO2 over the long term • CO2 is more soluble in cold saline waters and enters the deep reservoir where this water sinks (N. Atlantic and off Antarctica) (solubility pump) • As Earth warms, ocean will be more stratified, which will slow this sinking and slow oceanic uptake of CO2 • The CO2 buffering capacity will also weaken over time since cations from weathering are required to balance system • Plankton remove CO2, which aids the absorption of CO2 from the atmosphere and sinking takes some of this away (CaCO3 shells help too) (biological pump) • None of these are enough and CO2 continues to increase in the atmosphere • Increase the “biological pump” by fertilization or having a change in the C:N:P ratio of plankton could affect C cycle
Sinks for CO2 • Terrestrial biota also take up CO2, but there is no pump and CO2 returns to the atmosphere from respiration (50% by plants and 50% by microbes) • Since primary production is not saturated with CO2, uptake will increase as CO2 increases. However, rubisco saturates at 800-1000 ppmv and increased uptake before that will decreases over time (microbes may increase respiration too) • We have to consider changes in the cycles of other elements as well since these affect production and decomposition
A Lot of CO2 Can Dissolve in Seawater However, only surface water is in contact with the atmosphere and deep mixing is slow
Methane sources • Methane is produced by anaerobic bacteria in wetlands (including rice paddies), the rumen, termite guts, and landfills. • It is also released during gas and coal production Atmospheric methane concentrations
Methane hydrates • Crystalline solid consisting of gas molecules, usually methane, surrounded by a cage of water molecules. It looks like ice. Stable in ocean floor greater than 300 m, and can be in a layer several hundred meters thick. • More abundant than all fossil fuels combined